On Wednesday gold for delivery in December traded within the range of $1,084.20-$1,091.40. Futures closed at $1,084.70, losing 0.32% on a daily basis. It has been the seventh drop in the past eight trading days. The daily low has been the lowest level since August 7th, when the commodity went down as low as $1,081.70.
On the Comex division of the New York Mercantile Exchange, gold futures for delivery in December were gaining 0.18% for the day to trade at $1,086.80 per troy ounce. The yellow metal went up as high as $1,088.70 earlier today, while overshooting the upper range breakout level (R4). The commodity has been trading below the weekly central pivot level for a fourth consecutive day.
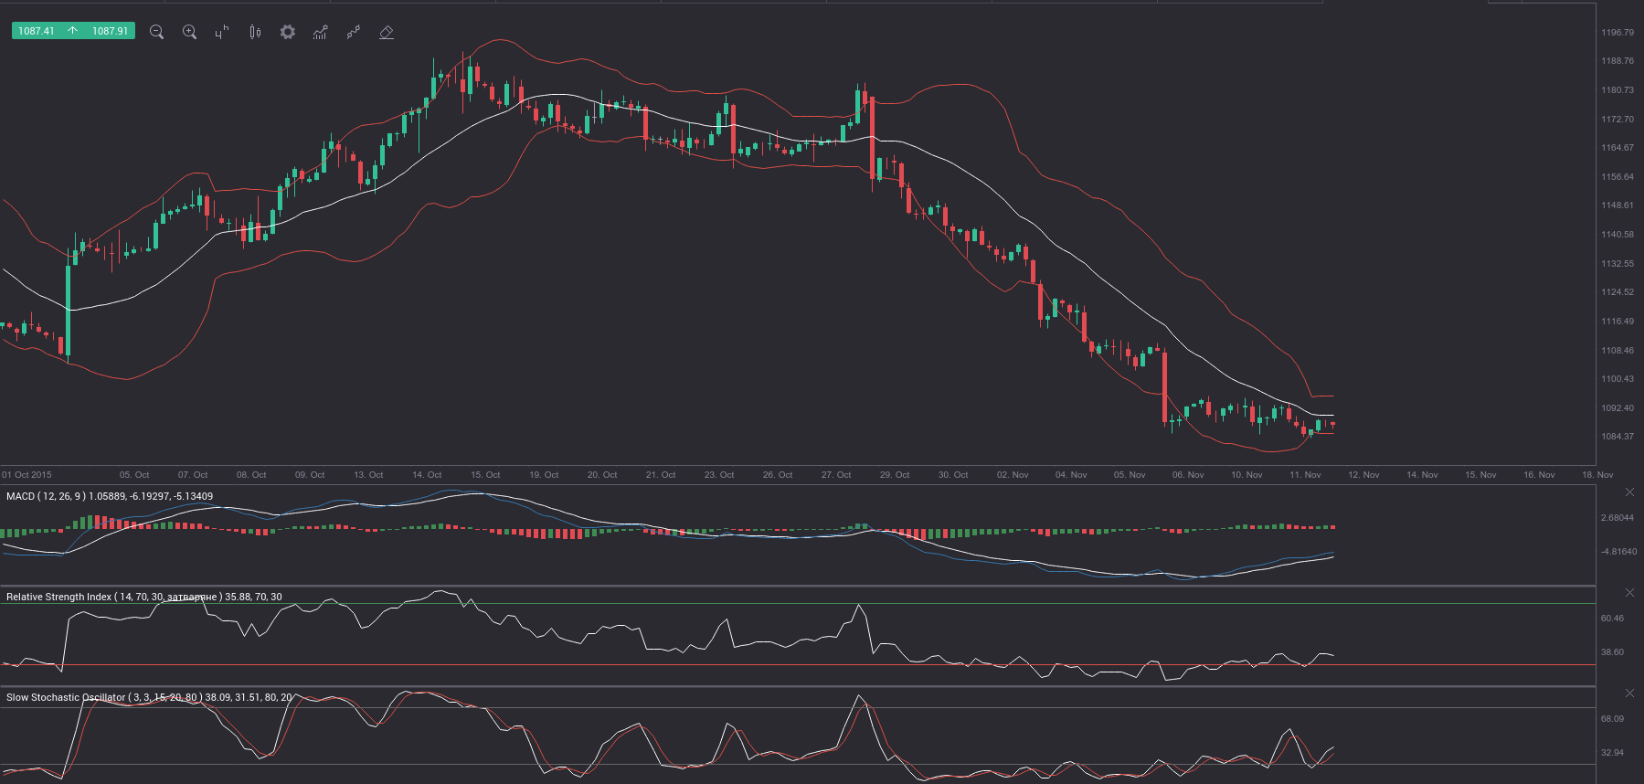
Gold has been deeply oversold since the beginning of November, as a result of which a prominent low was reached on November 6th at $1,084.80. Since then the commodity has been trading in a relatively tight range. Since late October the precious metal has been holding steadily between the lower and the middle Bollinger bands, as there has been only one attempt for a test of the middle line (on November 11th), which led to a bounce back to the oversold area.
Breakouts from ranges could occur from either side, but as the move preceding the range has been a bearish one, there is a certain probability a breakout to the downside could occur. In case yesterdays low of $1,084.20 is broken, the metal may continue down in an attempt to test August 7th low ($1,081.70), which has also been the lowest price level since March 2010. Such a scenario is very likely, in case we observe strong macroeconomic numbers from the United States on Friday and on Tuesday next week, which would add to the case of an interest rate hike by the Federal Reserve in December.
On the other hand, a break and consistent close above the area of resistance ($1,089-$1,095) may send gold up for a test of November 6th high of $1,109.50.
Daily and Weekly Pivot Levels
By employing the Camarilla calculation method, the daily pivot levels for gold are presented as follows:
R1 – $1,085.36
R2 – $1,086.02
R3 (range resistance) – $1,086.68
R4 (range breakout) – $1,088.66
S1 – $1,084.04
S2 – $1,083.38
S3 (range support) – $1,082.72
S4 (range breakout) – $1,080.74
By using the traditional method of calculation, the weekly pivot levels for gold are presented as follows:
Central Pivot Point – $1,103.70
R1 – $1,122.60
R2 – $1,157.60
R3 – $1,176.50
S1 – $1,068.70
S2 – $1,049.80
S3 – $1,014.80