Yesterday’s trade saw USD/CAD within the range of 1.3149-1.3275. The pair closed at 1.3267, surging 0.87% on a daily basis, or at the most considerable rate since October 21st, when it went up 1.24%. The daily high has been the highest level since October 1st, when a high of 1.3334 was registered.
At 10:04 GMT today USD/CAD was losing 0.23% for the day to trade at 1.3238. The pair overshot the range support level (S3), as it touched a daily low at 1.3226 at 9:20 GMT.
Today USD/CAD trading may be influenced by the events listed below.
Fundamentals
United States
FOMC policy decision
The Federal Open Market Committee (FOMC) will probably keep its target for the federal funds rate unchanged within the range 0%-0.25% for a 54th consecutive meeting, according to the median forecast by experts.
In September the Committee left borrowing costs intact, as macroeconomic conditions, which would warant a hike, had not yet been met, but were approaching. The Minutes from the Federal Reserves most recent policy meeting revealed officials expressed concerns recent global and financial market developments might pose constraints to US economic activity.
According to extracts from the minutes of the FOMCs September meeting: ”…members judged that information received since the FOMC met in July indicated that economic activity was expanding at a moderate pace. Although net exports remained soft, economic growth was broadly based. Members noted that recent global and financial market developments might restrain economic activity somewhat as a result of the higher level of the dollar and possible effects of slower economic growth in China and in a number of emerging market and commodity-producing economies.”
”In assessing whether economic conditions had improved sufficiently to initiate a firming in the stance of policy, many members said that the improvement in labor market conditions met or would soon meet one of the Committees criteria for beginning policy normalization. But some indicated that their confidence that inflation would gradually return to the Committees 2 percent objective over the medium term had not increased, in large part because recent global economic and financial developments had imparted some restraint to the economic outlook and placed further downward pressure on inflation in the near term.”
”…all but one member concluded that, although the U.S. economy had strengthened and labor underutilization had diminished, economic conditions did not warrant an increase in the target range for the federal funds rate at this meeting.”
The FOMC will announce its official decision on policy at 18:00 GMT. In case a rate hike is introduced, this will certainly cause a strong bullish impact on the US dollar.
Bond Yield Spread
The yield on Canada’s 2-year government bonds went as high as 0.518% on October 27th, after which it closed at 0.493% to lose 2.5 basis points (0.025 percentage point) compared to October 26th, while marking a second straight trading day of decline.
The yield on US 2-year government bonds climbed as high as 0.641% on October 27th, after which it closed at 0.625% to lose 1.2 basis points (0.012 percentage point) compared to October 26th. It has been the second trading day of decrease in a row.
The spread between 2-year US and 2-year Canadian bond yields, which reflects the flow of funds in a short term, expanded to 0.132% on October 27th from 0.119% on October 26th. The October 27th yield spread has been the largest one since September 29th, when the difference was 0.145%.
Meanwhile, the yield on Canada’s 10-year government bonds soared as high as 1.442% on October 27th, after which it slid to 1.420% at the close to lose 2.3 basis points (0.023 percentage point) compared to October 26th. It has been the second consecutive trading day of decline.
The yield on US 10-year government bonds climbed as high as 2.060% on October 27th, after which it slipped to 2.042% at the close to lose 1.6 basis points (0.016 percentage point) compared to October 26th. It has been the second trading day of decrease in a row.
The spread between 10-year US and 10-year Canadian bond yields widened to 0.622% on October 27th from 0.615% on October 26th. The October 27th yield difference has been the largest one since September 29th, when the spread was 0.626%.
Technical Commentary
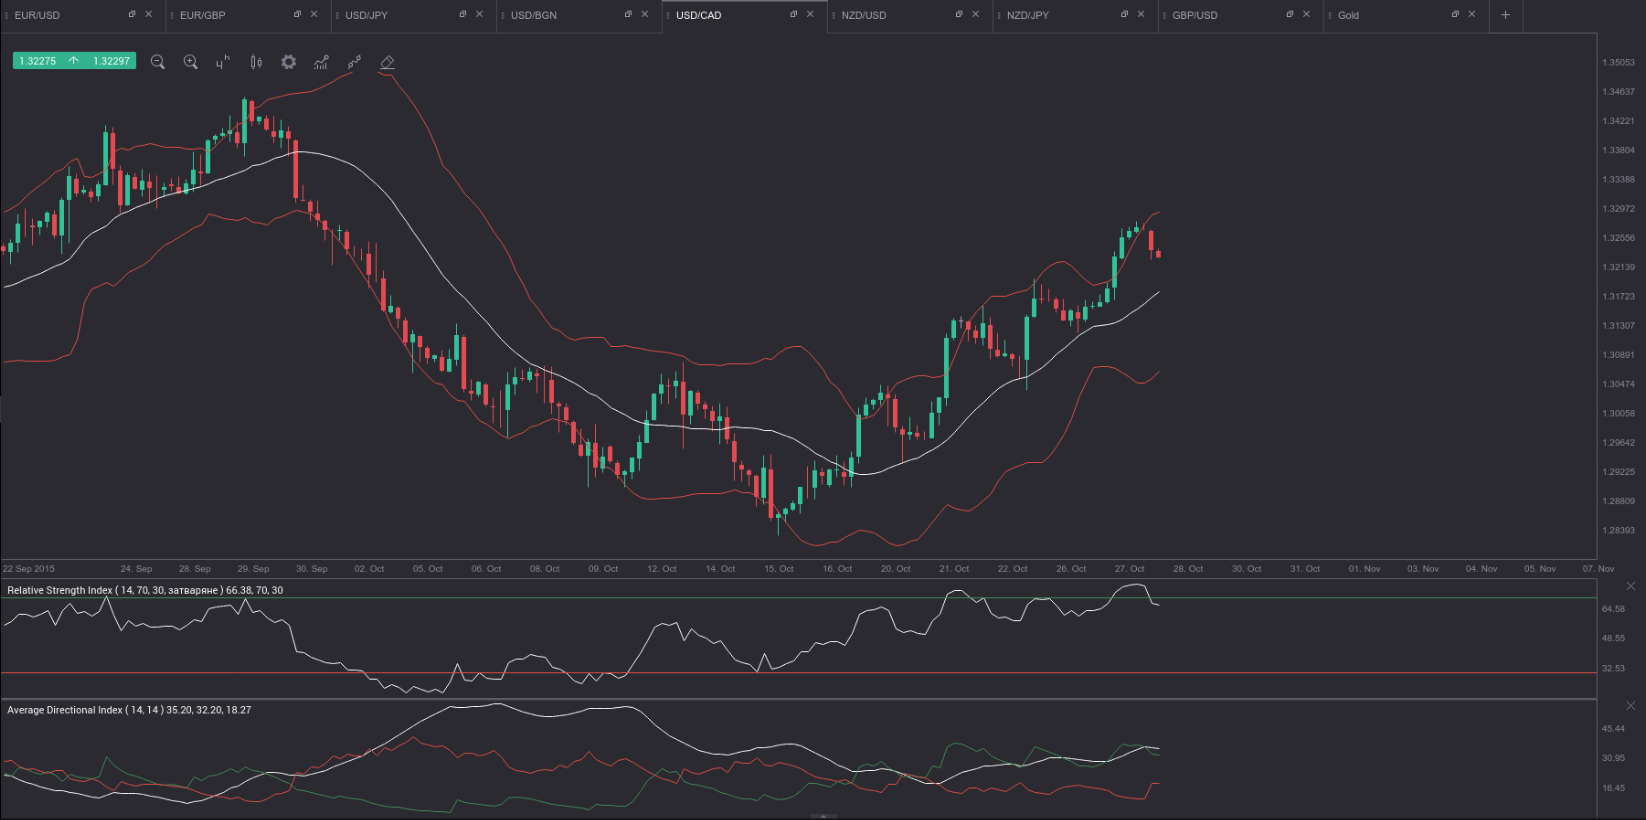
USD/CAD has been moving in a bullish channel since mid-October. The pair has returned inside the area between the lower and the upper Bollinger bands, after having been overbought. Since October 19th USD/CAD has been holding above the middle Bollinger band, as it came into contact with the latter on two occasions – the pair found support there on October 20th and overshot the middle band on October 23rd.
From this point on, we can expect a certain retreat to the middle band, but if the pair continues to hold between that middle band and the upper band, this may be indicative of bullish move continuation. In addition, the ADX still remains well above its 25.00 level, while the +DI (green) continues to hold above the -DI (red), thus, supporting the view of a bullish move. In case we witness continuous closing above the middle Bollinger band, it is reasonable to expect another test of the upper band somewhere in the area around October 1st high (1.3334).
If, however, we witness penetration below the middle Bollinger band, a test of October 27th low at 1.3149 may be at hand. Let us not forget that bullish channels tend to act more like bear flags!
Daily and Weekly Pivot Levels
By employing the Camarilla calculation method, the daily pivot levels for USD/CAD are presented as follows:
R1 – 1.3279
R2 – 1.3290
R3 (range resistance) – 1.3303
R4 (range breakout) – 1.3336
S1 – 1.3255
S2 – 1.3244
S3 (range support) – 1.3232
S4 (range breakout) – 1.3198
By using the traditional method of calculation again, the weekly pivot levels for USD/CAD are presented as follows:
Central Pivot Point – 1.3087
R1 – 1.3277
R2 – 1.3390
R3 – 1.3580
S1 – 1.2974
S2 – 1.2784
S3 – 1.2671