Yesterday’s trade saw USD/CAD within the range of 1.3080-1.3160. The pair closed at 1.3089, falling 0.38% on a daily basis, while marking its fourth loss in the past nine trading days. The daily high exceeded the high from Wednesday and has been the highest level since October 5th, when a high of 1.3176 was reached.
At 9:16 GMT USD/CAD was down 0.06% for the day to trade at 1.3085. The pair touched a daily low at 1.3056 at 6:55 GMT and later found support in the area 1.3057-1.3065.
Today USD/CAD trading may be influenced by the macroeconomic releases listed below.
Fundamentals
United States
Manufacturing PMI by Markit – preliminary reading
Manufacturing activity in the United States probably slowed down in October, with the corresponding preliminary Purchasing Managers Index coming in at a reading of 52.8, according to market expectations. If so, this would be the lowest reading since October 2013, when the PMI was reported at 51.8. In September the final seasonally adjusted PMI stood at 53.1, improving from a preliminary 53.0.
According to Markits statement: ”Both output and new business volumes continued to expand at slower rates than those seen earlier in 2015, which contributed to a marked slowdown in job creation during the latest survey period. A renewed fall in input prices provided support to operating margins in September. That said, factory gate charges were unchanged over the month, which ended a three-year period of sustained output price inflation”.
Values above the key level of 50.0 indicate optimism (expanding activity). In case the flash manufacturing PMI showed a worse-than-anticipated performance, this would have a moderate bearish effect on the US dollar. The preliminary PMI reading by Markit Economics is due out at 13:45 GMT.
Canada
Consumer inflation
The annualized consumer inflation in Canada probably slowed down to 1.1% in September, according to market expectations, from 1.3% in August. If so, this would be the lowest annual rate of inflation since June, when it was reported at 1.0%.
In August prices of food went up 3.6% year-on-year, which offset the further slide in prices of energy. Cost of household operations, furnishings and equipment rose 2.5% year-on-year in August, following a 3.3% surge in the previous month. This deceleration was mainly attributable to a lesser climb in the telephone services index. The latter increased 0.5% during the period, following a 3.9% gain in July. Cost of shelter went up 1.1% in August, while cost of transportation, on the other hand, fell at an annualized 2.3%, according to the report by the Statistics Canada.
Bank of Canadas (BoC) annualized Core CPI, which excludes prices of fruits, vegetables, gasoline, fuel oil, natural gas, mortgages, intercity transportation, and tobacco products, probably increased 2.1% in September, while matching the rate of increase posted in the prior month. It has been the lowest annual core inflation since February, when a rate of 2.1% was reported. This is the key measure of inflation, on which the central bank bases its decisions regarding monetary policy. In case both the general CPI and the core CPI decelerated more than projected in September, this would have a strong bearish impact on the Canadian dollar. The official CPI report by the Statistics Canada is due out at 12:30 GMT.
Bond Yield Spread
The yield on Canada’s 2-year government bonds went as high as 0.550% on October 22nd, after which it closed at 0.522% to lose 1.1 basis points (0.011 percentage point) compared to October 21st, while marking a second consecutive trading day of decrease.
The yield on US 2-year government bonds climbed as high as 0.641% on October 22nd, or matching the high from the previous trading day, after which it fell to 0.617% at the close to lose 0.008 percentage point compared to October 21st, while marking a second straight trading day of decline.
The spread between 2-year US and 2-year Canadian bond yields, which reflects the flow of funds in a short term, expanded to 0.095% on October 22nd from 0.092% during the prior day. The October 22nd yield spread has been the largest one since October 7th, when the difference was 0.098%.
Meanwhile, the yield on Canada’s 10-year government bonds soared as high as 1.487% on October 22nd, after which it slid to 1.452% at the close to lose 0.005 percentage point compared to October 21st, while marking a second consecutive trading day of decline.
The yield on US 10-year government bonds climbed as high as 2.055% on October 22nd, after which it slipped to 2.037% at the close to lose 0.009 percentage point compared to October 21st. It has been the fourth increase in the past nine trading days.
The spread between 10-year US and 10-year Canadian bond yields widened to 0.585% on October 22nd from 0.564% during the prior day. The October 22nd yield difference has been the largest one since October 13th, when the spread was 0.596%.
Technical Commentary
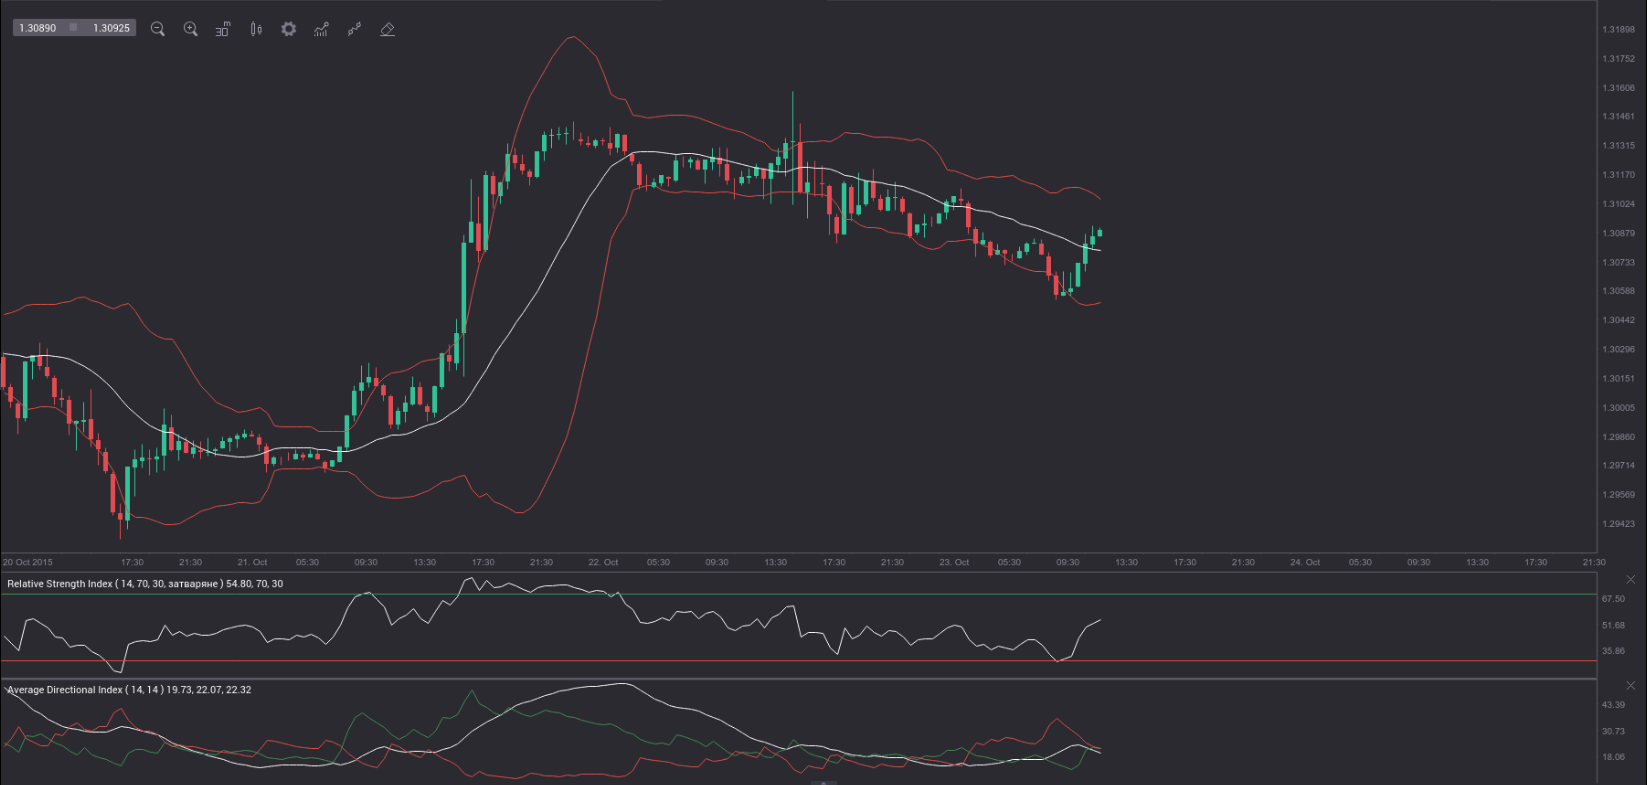
The 30-minute chart of USD/CAD reveals the pair has been moving in a relatively tight bearish channel since early Asian trade. Breakouts from such formations could occur from either side, but there is a tendency for bearish channels to act more like bull flags.
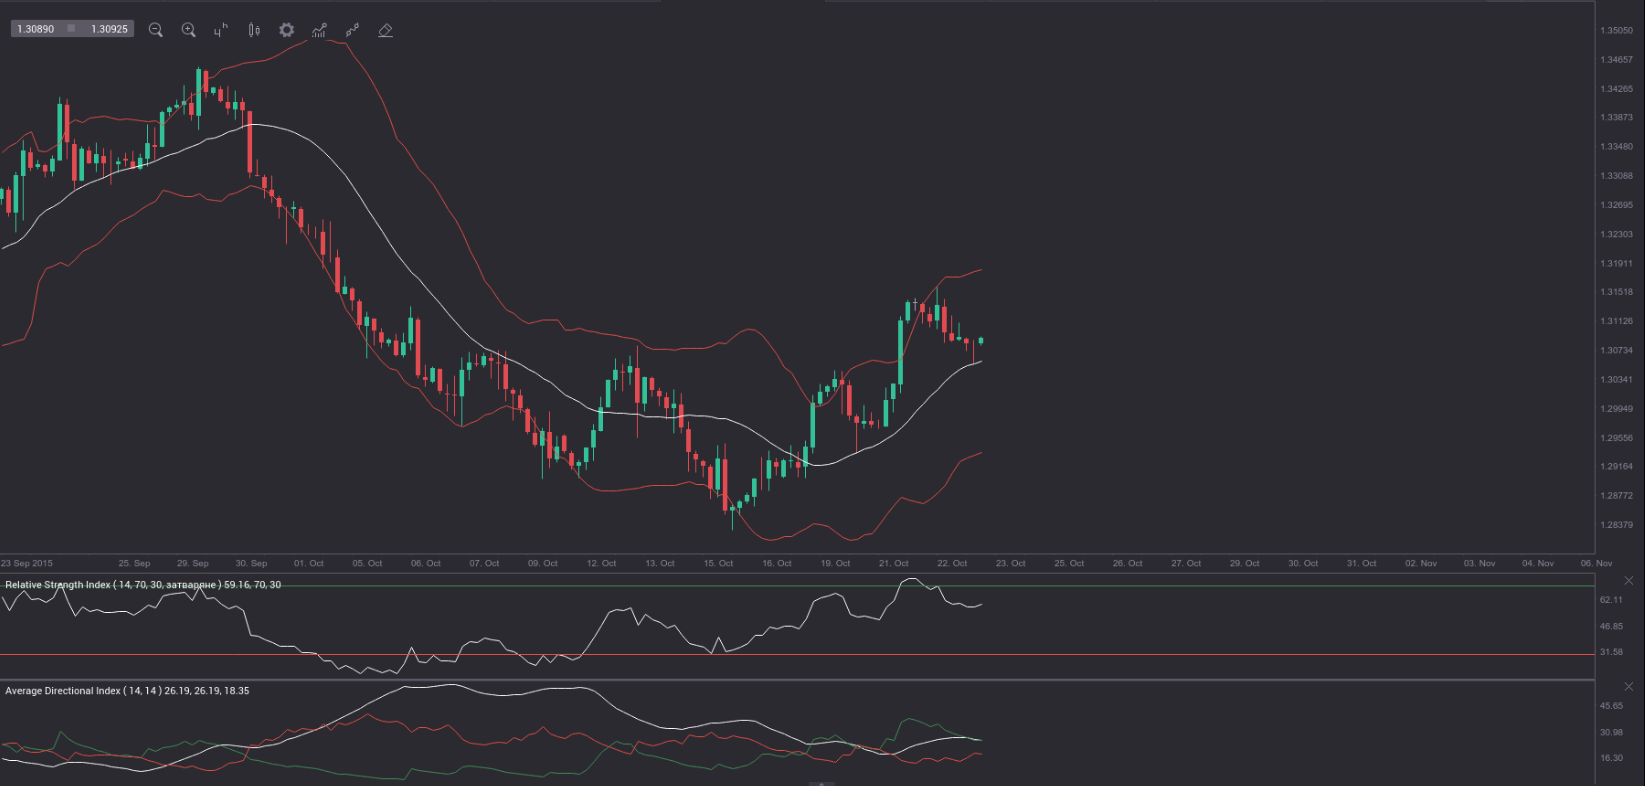
The 4-hour chart suggests that further upside may be on the horizon. The pair has returned for a test of the middle Bollinger line and seemed to have found support there. If it continues to move between the middle and the upper band, it is reasonable to expect a test of the upper band. In addition, the RSI has distanced from its overbought level and still remains above 50.00, while the +DI (green) is still above the -DI (red) and the ADX (white) is above 25.00.
Daily and Weekly Pivot Levels
By employing the Camarilla calculation method, the daily pivot levels for USD/CAD are presented as follows:
R1 – 1.3096
R2 – 1.3104
R3 (range resistance) – 1.3112
R4 (range breakout) – 1.3133
S1 – 1.3082
S2 – 1.3074
S3 (range support) – 1.3067
S4 (range breakout) – 1.3045
By using the traditional method of calculation again, the weekly pivot levels for USD/CAD are presented as follows:
Central Pivot Point – 1.2940
R1 – 1.3053
R2 – 1.3195
R3 – 1.3308
S1 – 1.2798
S2 – 1.2685
S3 – 1.2543