Yesterday’s trade saw USD/CAD within the range of 1.2965-1.3144. The pair closed at 1.3139, surging 1.21% on a daily basis, or at the steepest rate since July 15th, when it appreciated 1.49%. The daily high has been the highest level since October 5th, when a high of 1.3176 was reached.
At 9:44 GMT USD/CAD was losing 0.18% for the day to trade at 1.3114. The pair tested the daily R2 level, as it touched a daily low at 1.3106 at 8:50 GMT.
Today USD/CAD trading may be influenced by the macroeconomic releases listed below.
Fundamentals
United States
Initial, Continuing Jobless Claims
The number of people in the United States, who filed for unemployment assistance for the first time during the business week ended on October 16th, probably increased to 265 000, according to market expectations, from 255 000 in the previous week. The latter has been the lowest number of claims since the business week ended on July 17th, when 255 000 claims were reported. It has also been the lowest level since November 1973.
The 4-week moving average, an indicator lacking seasonal effects, was 265 000, marking a decrease of 2 250 compared to the preceding weeks revised down average. It has been the lowest level for this average since December 15th 1973, when 256 750 claims were reported.
The business week, which ended on October 9th has been the 32nd consecutive week, when jobless claims stood below the 300 000 threshold.
Initial jobless claims number is a short-term indicator, reflecting lay-offs in the country. In case the number of claims met expectations or increased further, this would have a moderate bearish effect on the US dollar.
The number of continuing jobless claims probably increased to the seasonally adjusted 2 188 000 during the business week ended on October 9th, from 2 158 000 in the prior week. It has been the lowest number of claims since November 4th 2000, when a level of 2 110 000 was reported. It also represented a drop by 50 000 compared to the revised up number of claims reported in the week ended on September 25th. This indicator reflects the actual number of people unemployed and currently receiving unemployment benefits, who filed for unemployment assistance at least two weeks ago.
The Department of Labor is to release the weekly report at 12:30 GMT.
Existing Home Sales
The index of existing home sales in the United States probably rose 1.0% to a level of 5.38 million in September compared to August, according to the median estimate by experts. In August sales were 4.8% lower from a month ago to reach 5.31 million, or the lowest level since April 2015 (5.04 million).
The sample of data encompasses condos, co-ops and single-family houses. Statistical data on existing home sales are often used along with statistical figures regarding the new home sales and pending home sales, with the major objective being to draw a conclusion how the nation’s housing sector is performing, regardless of interest rates.
The report on existing home sales usually does not cause a real direct impact on US economy. Actually, this effect appears to be minimal, due to the fact that nothing is produced with the mere sale of an existing home. In terms of economic activity, the sale of an existing house may be related only to interior design and purchases of new furniture.
In case the index increased at a steeper monthly rate than anticipated, this would have a limited bullish effect on the US dollar. The National Association of Realtors (NAR) is to release the official figure at 14:00 GMT.
CB Leading Indicator
The Conference Board Leading Economic Index for the United States probably remained unchanged in September compared to a month ago, according to the median estimate by experts. In August the index rose at a monthly rate of 0.1%.
It encompasses a variety of economic indicators, which signify possible changes in overall economic activity. The index is comprised by the following components: average weekly hours in manufacturing, average weekly initial claims for unemployment insurance, manufacturers’ new orders, consumer goods and materials, ISM Index of New Orders, manufacturers new orders, nondefense capital goods excluding aircraft orders, building permits, new private housing units, Stock prices, 500 common stocks, Leading Credit Index, interest rate spread, 10-year Treasury bonds less federal funds, average consumer expectations for business conditions. Worse-than-expected performance of the index would have a moderate bearish effect on the US dollar. The Conference Board research group will release the official data at 14:00 GMT.
Canada
Retail sales
Retail sales in Canada probably increased 0.1% in August on a monthly basis, according to the median forecast by experts. If so, it would be the fourth consecutive month of increases. In July sales went up 0.5%. Retail sales, excluding sales of automobiles, probably expanded 0.1% in August compared to the preceding month, after a flat performance in July. Large-ticket purchases are excluded due to their high volatility, which could influence the general trend. In case core retail sales rose more than anticipated, this would have a moderate bullish effect on the Canadian dollar. Statistics Canada is to release the official report at 12:30 GMT.
Bond Yield Spread
The yield on Canada’s 2-year government bonds went as high as 0.566% on October 21st, or the highest level since October 9th (0.567%), after which it closed at 0.533% to lose 2.5 basis points (0.025 percentage point) compared to October 20th.
The yield on US 2-year government bonds climbed as high as 0.641% on October 21st, or the highest level since October 12th (0.641%), after which it fell to 0.625% at the close to lose 0.008 percentage point compared to October 20th. It has been the sixth decline in the past eight trading days.
The spread between 2-year US and 2-year Canadian bond yields, which reflects the flow of funds in a short term, expanded to 0.092% on October 21st from 0.075% during the prior day. The October 21st yield spread has been the largest one since October 7th, when the difference was 0.098%.
Meanwhile, the yield on Canada’s 10-year government bonds soared as high as 1.541% on October 21st, after which it slid to 1.460% at the close to lose 8 basis points (0.08 percentage point) compared to October 20th.
The yield on US 10-year government bonds climbed as high as 2.072% on October 21st, after which it slipped to 2.021% at the close to lose 4.8 basis points (0.048 percentage point) compared to October 20th. It has been the fifth drop in the past eight trading days.
The spread between 10-year US and 10-year Canadian bond yields widened to 0.561% on October 21st from 0.518% during the prior day. The October 21st yield difference has been the largest one since October 19th, when the spread was 0.566%.
Technical Commentary
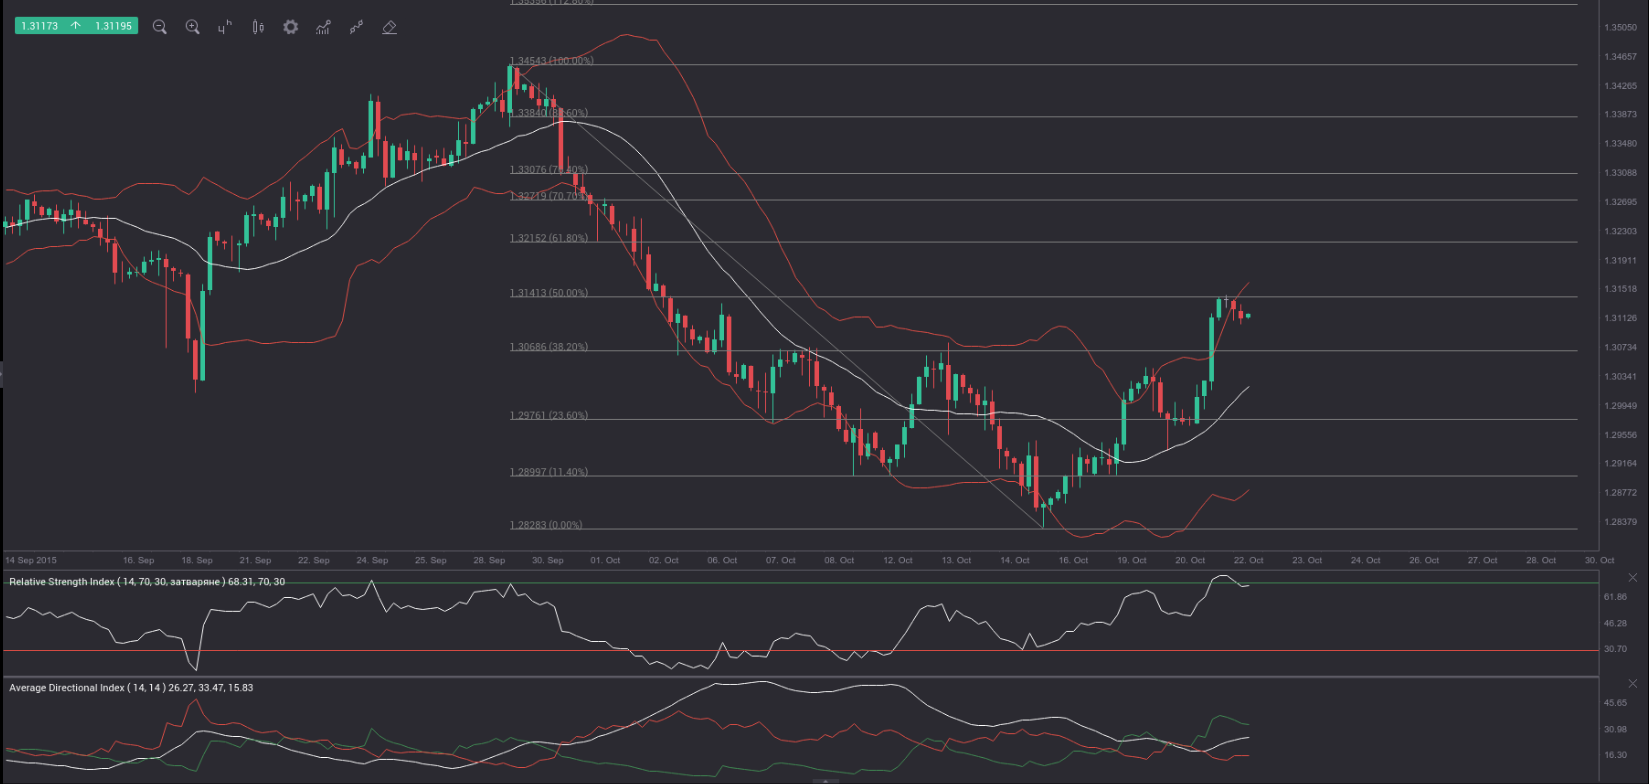
Yesterdays decision by the Bank of Canada to leave borrowing costs unchanged at 0.50% sent USD/CAD above the 38.20% Fibonacci level, which reflects the descent from September 29th high to October 10th low. As can be seen from the 4-hour chart below, the up move was halted at the 50.00% Fibonacci. In addition, the RSI remains very close to its 70.00 level, indicating overbought conditions. After penetrating the upper band of the Bollinger, the pair has moved back within the area between the two bands and is poised to return to the median level (middle Bollinger line (white)).
Daily and Weekly Pivot Levels
By employing the Camarilla calculation method, the daily pivot levels for USD/CAD are presented as follows:
R1 – 1.3155
R2 – 1.3172
R3 (range resistance) – 1.3188
R4 (range breakout) – 1.3237
S1 – 1.3123
S2 – 1.3106
S3 (range support) – 1.3090
S4 (range breakout) – 1.3041
By using the traditional method of calculation again, the weekly pivot levels for USD/CAD are presented as follows:
Central Pivot Point – 1.2940
R1 – 1.3053
R2 – 1.3195
R3 – 1.3308
S1 – 1.2798
S2 – 1.2685
S3 – 1.2543