Yesterday’s trade saw EUR/USD within the range of 1.1282-1.1375. The pair closed at 1.1321, losing 0.19% on a daily basis. It has been the first drop in the past seven trading days and also the most modest one since August 13th, when the cross fell 0.07%. The daily high has also been the highest level since August 26th, when the cross registered a high of 1.1562.
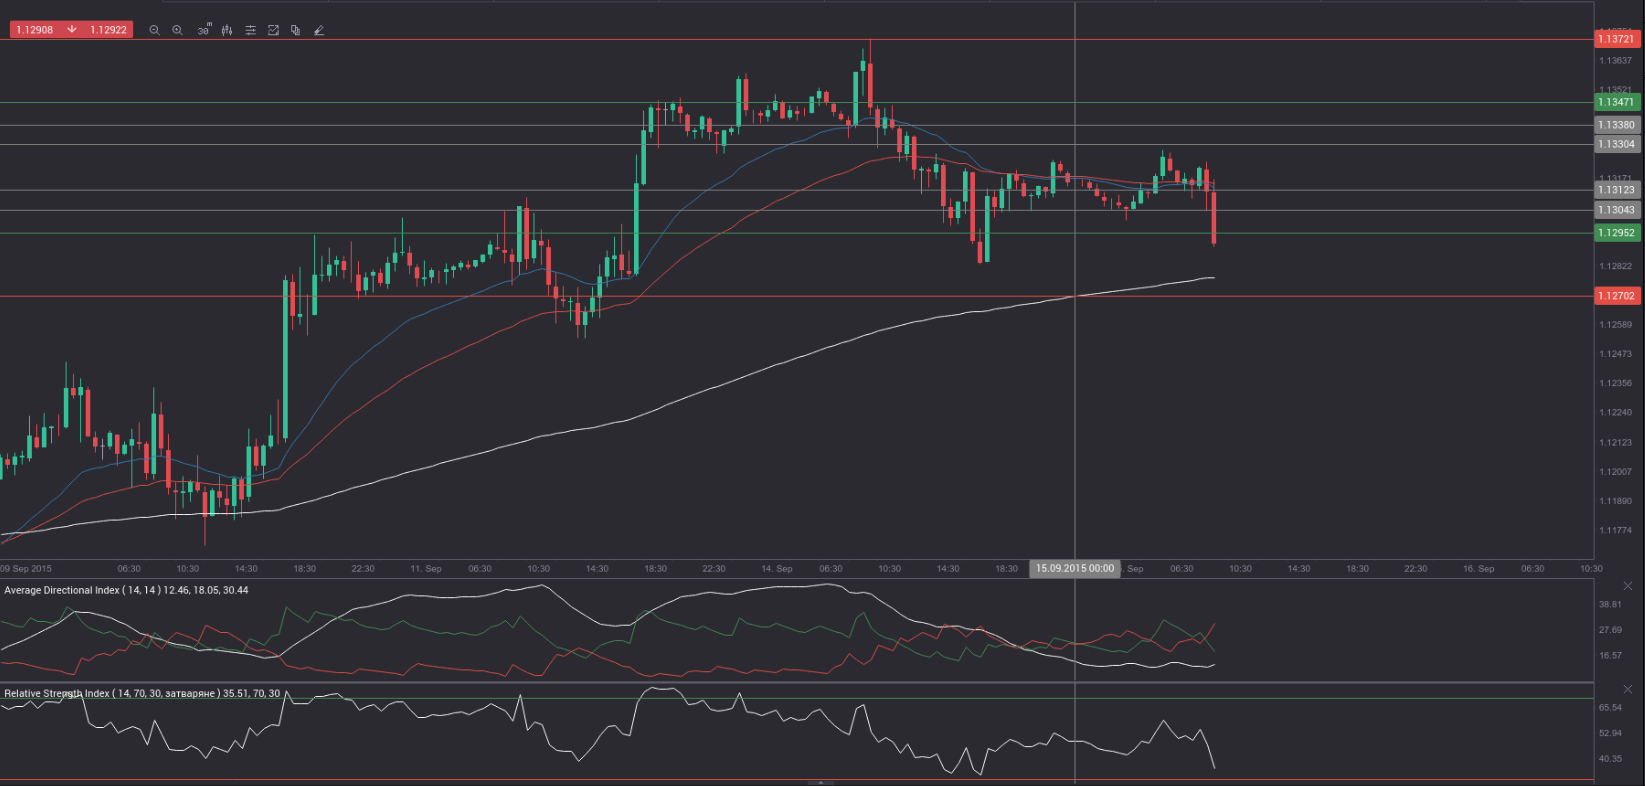
At 6:45 GMT today EUR/USD was down 0.15% for the day to trade at 1.1302. The pair overcame the range support level (S3), as it touched a daily low at 1.1288 at 7:00 GMT.
Today the cross may be influenced by a number of macroeconomic reports as listed below.
Fundamentals
Euro area
ZEW Survey – Germany, Eurozone
The gauge of economic sentiment in Germany probably dropped for a sixth month in a row in September to reach 20.0, according to the median forecast by experts. If so, it would be the lowest value since November 2014, when the index was reported at 11.5. In July the index came at a reading of 25.0.
The ZEW (Zentrum für Europäische Wirtschaftsforschung) economic expectations index is reported on a monthly basis. The study encompasses up to 350 financial and economic analysts. The indicator reflects the difference between the share of analysts, that are optimistic and those, that are pessimistic about the expected economic development in Germany over the next six months. A positive value indicates that the proportion of optimists is larger than that of pessimists. A ZEW reading of -100 suggests that all analysts are pessimistic about the current developments and expect economic conditions to deteriorate. A ZEW reading of 100 implies that all analysts are optimistic about the current situation and expect conditions to improve. A ZEW reading of 0 indicates neutrality.
The index of current assessment in Germany probably fell to 64.0 in September, according to market expectations, from 65.7 in August. The latter has been the highest level since May, when a value of 65.7 was reported.
The ZEW Economic Sentiment index for the whole Euro zone probably remained unchanged in September at 47.6, according to market expectations. In July the gauge was reported at 42.7, which has been the lowest level since December 2014, when the index slid to 31.8.
In case the German gauge of economic sentiment decreased at a sharper pace than expected, this would have a strong bearish effect on the common currency. The official data is scheduled to be released at 9:00 GMT.
Balance of Trade
At 9:00 GMT Eurostat is expected to report on the euro regions trade balance for July. The regions trade surplus, without a seasonal adjustment, was reported to have expanded to EUR 26.4 billion in June, or reaching a new all-time high level. Goods exports rose at an annualized rate of 12% to reach EUR 182.7 billion in June, while imports were up 7% year-on-year to EUR 156.4 billion.
Total exports from the Euro area were up 6% to EUR 1011.7 billion in the period January-June 2015 compared to the same period a year ago. At the same time, total imports surged 3% to EUR 896.7 billion during the same period. This resulted in a trade surplus of EUR 115.0 billion in January-June 2015, up from a surplus of EUR 76.4 billion in January-June 2014.
Euro zones balance of trade produces regular surpluses mainly due to the high export of manufactured goods, such as machinery and vehicles. At the same time, the region is a net importer of energy and raw materials. Member states such as Germany, Italy, France and Netherlands play a key role in total trade.
In case the trade surplus continued to expand, this would be a moderate bullish signal for the common currency.
United States
Retail sales
Retail sales in the United States probably rose 0.4% in August on a monthly basis, according to the median forecast by experts. In July sales were up another 0.6%, while the June performance was revised up to flat from a 0.3% decrease previously.
Among the 13 major categories, 10 registered increases, while 1 showed no change. Sales at online stores marked the largest monthly increase in July (up 1.5%), followed by sales of motor vehicles (up 1.4%), sales at sporting goods, hobby, music and books stores (up 0.9%), sales at furniture stores (up 0.8%), sales of building materials and garden equipment (up 0.7%) and sales at food services & drinking places (up 0.7%). On the other hand, sales in general merchandise stores were 0.5% lower in July, while sales at electronics & appliance stores dropped 1.2%, according to the report by the US Census Bureau.
Annualized retail sales surged 2.4% in July, or at the fastest rate since January 2015, following a 1.4% climb in June.
US core retail sales, or retail sales ex autos, probably went up 0.3% in August compared to a month ago. If so, this would be the most modest monthly rate of increase since April 2015. In July core sales rose 0.4%. This indicator removes large ticket prices and historical seasonality of automobile sales.
The report on retail sales reflects the dollar value of merchandise sold within the retail trade by taking a sampling of companies, operating in the sector of selling physical end products to consumers. The retail sales report encompasses both fixed point-of-sale businesses and non-store retailers, such as mail catalogs and vending machines. The Census Bureau, which is a part of the Department of Commerce, surveys about 5 000 companies of all sizes, from huge retailers such as Wal-Mart to independent small family firms.
The retail sales index is considered as a coincident indicator, thus, it reflects the current state of the economy. It is also considered a pre-inflationary indicator, which investors can use in order to reassess the probability of an interest rate hike or cut by the Federal Reserve Bank. In addition, this indicator provides key information regarding consumer spending trends. Consumer expenditures, on the other hand, account for almost two-thirds of the US Gross Domestic Product. Therefore, a larger-than-expected rate of increase in sales would have a strong bullish effect on the US dollar. The official report is due out at 12:30 GMT.
Industrial Production, Capacity Utilization
Industrial output in the United States probably shrank for the first time in three months in August, down at a monthly rate of 0.2%, according to market expectations. In July industrial production grew 0.6%, or at the sharpest monthly pace since November 2014, when the index surged 1.3%. Manufacturing production, which accounts for almost three quarters of total industrial production, expanded 0.8% in July, or at the fastest monthly rate since November last year. The index for mining went up 0.2% in July, after a 0.7% climb in June. The output of utilities slumped 1.0% in July, following a 2.3% increase in the prior month.
The index of industrial production reflects the change in overall inflation-adjusted value of output in the three major sectors mentioned above. The index is sensitive to consumer demand and interest rates. As such, industrial production is an important tool for future GDP and economic performance forecasts. Those figures are also used to measure inflation by central banks as very high levels of industrial production may lead to uncontrolled levels of consumption and rapid inflation. It is a coincident indicator, which means that changes in its levels generally echo similar shifts in overall economic activity. On the other hand, a larger-than-projected monthly decline in the index would usually have a moderate bearish effect on the US dollar.
The Board of Governors of the Federal Reserve is to release the production data at 13:15 GMT.
In addition, Capacity Utilization rate in the country probably decreased to 77.8% in August from 78.0% in July. If so, this would be the lowest utilization rate since July 2013, when a rate of 77.6% was reported. This indicator represents the optimal rate for a stable production process, or the highest possible level of production in an enterprise, in case it operates within a realistic work schedule and has sufficient raw materials and inventories at its disposal. High rates of capacity utilization usually lead to inflationary pressure. In general, lower-than-anticipated rates tend to have a limited bearish effect on the US dollar.
Bond Yield Spread
The yield on German 2-year government bonds went as high as -0.217% on September 14th, after which it slid to -0.228% at the close to lose 0.007 percentage point on a daily basis, while marking a second straight trading day of decline.
The yield on US 2-year government bonds climbed as high as 0.734% on September 14th, after which it fell to 0.730% at the close to add 2.1 basis points (0.021 percentage point) for the day. It has been the first gain in the past three trading days.
The spread between 2-year US and 2-year German bond yields, which reflects the flow of funds in a short term, widened to 0.958% on September 14th from 0.930% on September 11th. The September 14th yield spread has been the most notable one since September 9th, when the difference was 0.963%.
Meanwhile, the yield on German 10-year government bonds soared as high as 0.674% on September 14th, after which it slid to 0.658% at the close to remain unchanged compared to September 11th.
The yield on US 10-year government bonds climbed as high as 2.203% on September 14th, after which it slipped to 2.187% at the close to remain unchanged compared to September 11th.
The spread between 10-year US and 10-year German bond yields remained steady at 1.529% on September 14th. It has been the lowest yield difference since September 9th, when the spread was 1.492%.
Daily and Weekly Pivot Levels
By employing the Camarilla calculation method, the daily pivot levels for EUR/USD are presented as follows:
R1 – 1.1330
R2 – 1.1338
R3 (range resistance – green on the 30-minute chart) – 1.1347
R4 (range breakout – red on the 30-minute chart) – 1.1372
S1 – 1.1312
S2 – 1.1304
S3 (range support – green on the 30-minute chart) – 1.1295
S4 (range breakout – red on the 30-minute chart) – 1.1270
By using the traditional method of calculation, the weekly pivot levels for EUR/USD are presented as follows:
Central Pivot Point – 1.1270
R1 – 1.1419
R2 – 1.1499
R3 – 1.1648
S1 – 1.1190
S2 – 1.1041
S3 – 1.0961