Yesterday’s trade saw USD/JPY within the range of 118.83-120.23. The pair closed at 119.81, soaring 0.44% on a daily basis and extending gains from Monday. The daily high has also been the highest level since September 3rd, when the cross registered a high of 120.70.
At 7:44 GMT today USD/JPY was gaining 0.70% for the day to trade at 120.65. The pair touched a daily high at 120.74 at 7:25 GMT. It has been the highest level since September 1st, when the cross reached a high of 121.28.
Today the cross may be influenced by a number of macroeconomic reports as listed below.
Fundamentals
United States
Job Openings
The number of job openings in the United States probably increased to 5.301 million in July from 5.249 million in June. The latter has been the lowest figure since March, when 4.994 million job openings were reported. This indicator refers to all positions that are open, but not filled on the last business day of the month. Job openings are part of the Job Openings and Labor Turnover Survey (JOLTS), which gathers data from about 16 400 non-farm establishments including retailers and manufacturers, as well as federal, state, and local government entities in the 50 states and the District of Columbia. The survey assesses the unmet demand for labor in the labor market. Higher-than-projected number of openings will usually have a limited bullish effect on the US dollar. The Bureau of Labor Statistics is to release the official data at 14:00 GMT.
Japan
Machinery Orders
Machinery orders in Japan probably rose 3.7% in July compared to a month ago, according to the median forecast by experts, after a 7.9% slump in June. The latter has been the sharpest monthly decrease since May 2014, when the total value of orders dropped 19.5%. In annual terms, new orders, placed at major manufacturers in Japan, probably rose 10.5% in July. If so, this would be the eighth month in a row, during which machinery orders went up. In June new orders increased at an annualized rate of 16.6%.
Machinery orders are considered as an excellent leading indicator, providing clues over business capital spending in Japan. An increase in new orders suggests that business confidence has strengthened, which can also raise hopes over the nations economic growth. Therefore, in case new orders increased at a faster-than-anticipated pace, this would provide a positive impulse for the yen. Japanese Cabinet Office will release the official report at 23:50 GMT.
Bond Yield Spread
The yield on Japanese 2-year government bonds went as high as 0.025% on September 8th, or the highest level since May 7th (0.029%), after which it slid to 0.014% at the close to lose 0.001 percentage point on a daily basis. It has been a second straight day of decline.
The yield on US 2-year government bonds climbed as high as 0.741% on September 8th, or the highest level since August 31st (0.743%), after which it fell to 0.737% at the close to add 2 basis points (0.02 percentage point) for the day, while marking a third straight trading day of increase.
The spread between 2-year US and 2-year Japanese bond yields, which reflects the flow of funds in a short term, expanded to 0.723% on September 8th from 0.702% during the prior day. The September 8th yield spread has been the most notable one since August 31st, when the difference was 0.728%.
Meanwhile, the yield on Japans 10-year government bonds soared as high as 0.381% on September 8th, or the highest level since September 4th (0.396%), after which it slid to 0.370% at the close to appreciate 0.001 percentage point compared to September 7th. It has been the first gain in the past three trading days.
The yield on US 10-year government bonds climbed as high as 2.201% on September 8th, or the highest level since September 1st (2.214%), after which it slipped to 2.188% at the close to add 3.7 basis points (0.037 percentage point) on a daily basis, while marking a second consecutive day of gains.
The spread between 10-year US and 10-year Japanese bond yields widened to 1.818% on September 8th from 1.782% during the prior day. The September 8th yield difference has been the largest one since August 31st, when the spread was 1.833%.
Daily and Weekly Pivot Levels
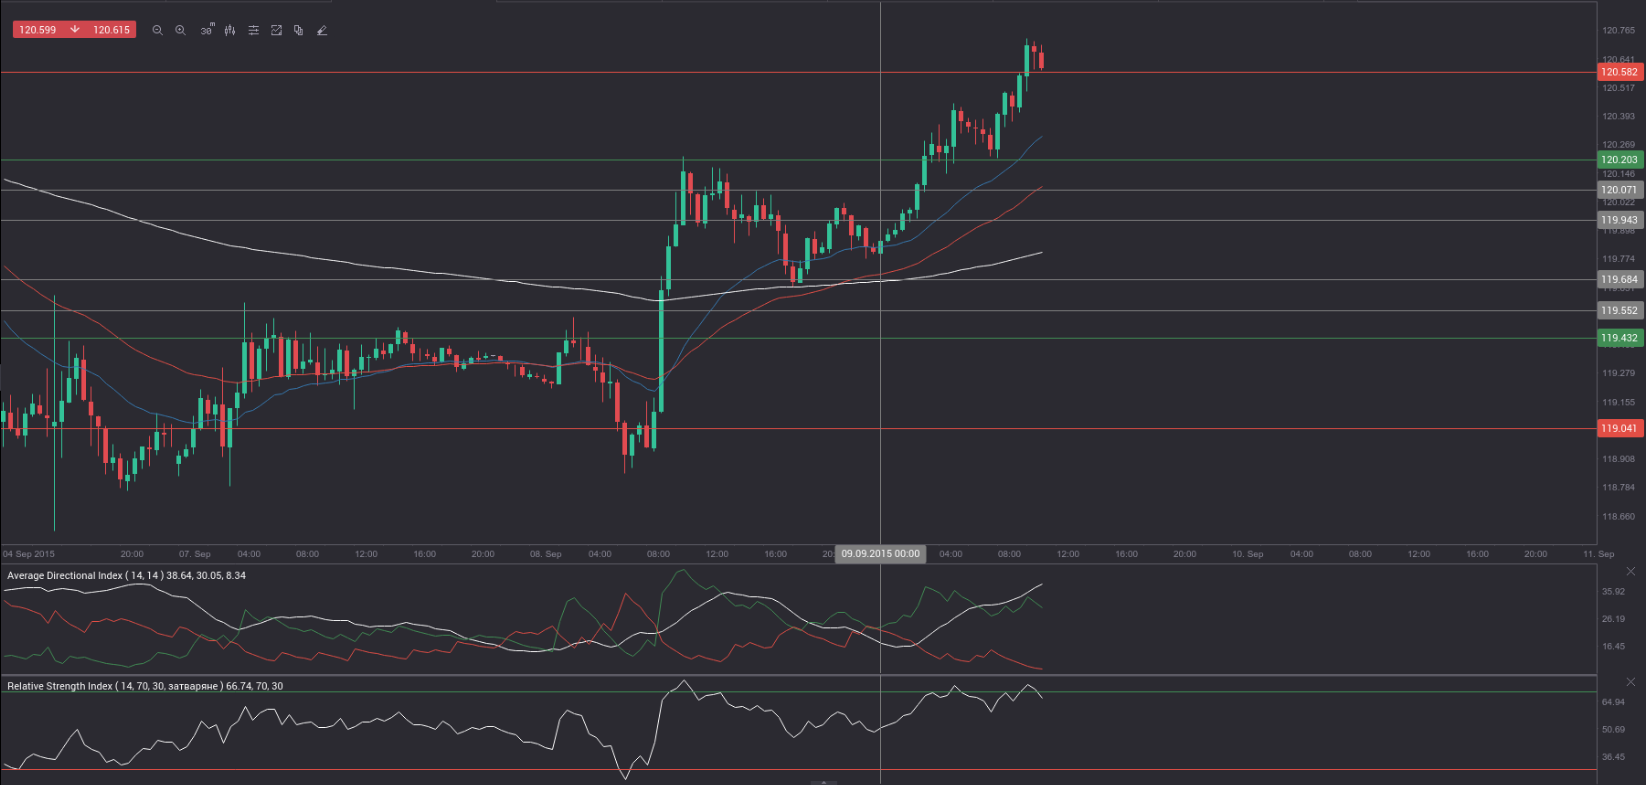
By employing the Camarilla calculation method, the daily pivot levels for USD/JPY are presented as follows:
R1 – 119.94
R2 – 120.07
R3 (range resistance – green on the 30-minute chart) – 120.20
R4 (range breakout – red on the 30-minute chart) – 120.58
S1 – 119.68
S2 – 119.55
S3 (range support – green on the 30-minute chart) – 119.43
S4 (range breakout – red on the 30-minute chart) – 119.04
By using the traditional method of calculation, the weekly pivot levels for USD/JPY are presented as follows:
Central Pivot Point – 119.83
R1 – 120.92
R2 – 122.83
R3 – 123.92
S1 – 117.92
S2 – 116.83
S3 – 114.92