Yesterday’s trade saw USD/CAD within the range of 1.3181-1.3312. The pair closed at 1.3208, falling 0.74% on a daily basis, or at the sharpest rate since August 31st, when it slid 0.79%. The daily high has been the highest level since September 2nd, when a high of 1.3326 was reached.
At 8:57 GMT today USD/CAD was up 0.11% for the day to trade at 1.3223. The pair touched a daily high at 1.3227 at 8:55 GMT.
Today the cross may be influenced by a number of macroeconomic reports and events as listed below.
Fundamentals
United States
Job Openings
The number of job openings in the United States probably increased to 5.301 million in July from 5.249 million in June. The latter has been the lowest figure since March, when 4.994 million job openings were reported. This indicator refers to all positions that are open, but not filled on the last business day of the month. Job openings are part of the Job Openings and Labor Turnover Survey (JOLTS), which gathers data from about 16 400 non-farm establishments including retailers and manufacturers, as well as federal, state, and local government entities in the 50 states and the District of Columbia. The survey assesses the unmet demand for labor in the labor market. Higher-than-projected number of openings will usually have a limited bullish effect on the US dollar. The Bureau of Labor Statistics is to release the official data at 14:00 GMT.
Canada
Housing Starts, Building Permits
Housing starts in Canada probably fell to the seasonally adjusted annual level of 190 000 in August, according to market expectations. If so, this would be the lowest number of housing starts since April, when a level of 181 800 was reported. In July the number of housing starts was 193 000. Housing starts are considered as a key indicator, reflecting the strength of the nation’s housing sector. In case the number of housing starts dropped more than expected, this would have a moderate bearish effect on the loonie. Canada’s Mortgage and Housing Corporation will release the official numbers at 12:15 GMT.
Meanwhile, the number of building permits in Canada probably decreased at a monthly rate of 5.0% in July, according to the median estimate by experts. In June permits, issued by the government, were 14.8% more, which has been the sharpest monthly rate of increase since June 2014, when permits rose 16.4%. Building permits, as an indicator, provide clues over future demand in Canada’s housing market. In case the number of permits fell more than anticipated, this might have a limited bullish effect on the Canadian dollar. Statistics Canada is to release its monthly report at 12:30 GMT.
Bank of Canada policy decision
Bank of Canada’s (BoC) Governing Council probably left the target for the benchmark interest rate (overnight rate) without change at 0.50% at the policy meeting today, according to expectations. At its meeting on July 15th the central bank cut its benchmark by 0.25% to the current level, citing a lower outlook for growth and higher risks to financial stability. It has been the first rate cut in the past five policy meetings. The Bank Rate was reduced to 0.75% from 1.00%, while the Deposit Rate was lowered to 0.25% from 0.50%.
According to excerpts from the most recent BoC Statement: ”Total CPI inflation in Canada has been around 1 per cent in recent months, reflecting year-over-year price declines for consumer energy products. Core inflation has been close to 2 per cent, with disinflationary pressures from economic slack being offset by transitory effects of the past depreciation of the Canadian dollar and some sector-specific factors. Setting aside these transitory effects, the Bank judges that the underlying trend in inflation is about 1.5 to 1.7 per cent.”
”The Bank now projects Canada’s real GDP will grow by just over 1 per cent in 2015 and about 2 1/2 per cent in 2016 and 2017. With this revised growth profile, the output gap is significantly larger than was expected in April, and closes somewhat later. The Bank anticipates that the economy will return to full capacity and inflation to 2 per cent on a sustained basis in the first half of 2017.”
”The lower outlook for Canadian growth has increased the downside risks to inflation. While vulnerabilities associated with household imbalances remain elevated and could edge higher, Canada’s economy is undergoing a significant and complex adjustment. Additional monetary stimulus is required at this time to help return the economy to full capacity and inflation sustainably to target.”
Short-term interest rates are of utmost importance for the valuation of national currencies. In case we witnessed a decision, which includes either maintaining or cutting the benchmark rate further, as a result of a more dovish view on economic development and inflationary pressure, this would have a significant bearish effect on the national currency.
The official policy decision is scheduled to be announced at 14:00 GMT.
Bond Yields
The yield on Canadian 2-year government bonds went as high as 0.465% on September 8th, or the highest level since August 10th (0.466%), after which it slid to 0.434% at the close to lose 0.007 percentage point compared to September 4th.
The yield on US 2-year government bonds climbed as high as 0.741% on September 8th, or the highest level since August 31st (0.743%), after which it fell to 0.737% at the close to add 2 basis points (0.02 percentage point) for the day, while marking a third straight trading day of increase.
The spread between 2-year US and 2-year Canadian bond yields, which reflects the flow of funds in a short term, widened to 0.303% on September 8th from 0.268% on September 4th. The September 8th yield difference has been the largest one since August 28th, when the spread was 0.308%.
Meanwhile, the yield on Canadian 10-year government bonds soared as high as 1.495% on September 8th, or the highest level since August 6th (1.512%), after which it closed at 1.471% to lose 3.2 basis points (0.032 percentage point) compared to September 4th.
The yield on US 10-year government bonds climbed as high as 2.201% on September 8th, or the highest level since September 1st (2.214%), after which it slipped to 2.188% at the close to add 3.7 basis points (0.037 percentage point) on a daily basis, while marking a second consecutive day of gains.
The spread between 10-year US and 10-year Canadian bond yields widened to 0.717% on September 8th from 0.692% on September 4th. The September 8th yield difference has been the most significant one since September 2nd, when the spread was 0.734%.
Daily and Weekly Pivot Levels
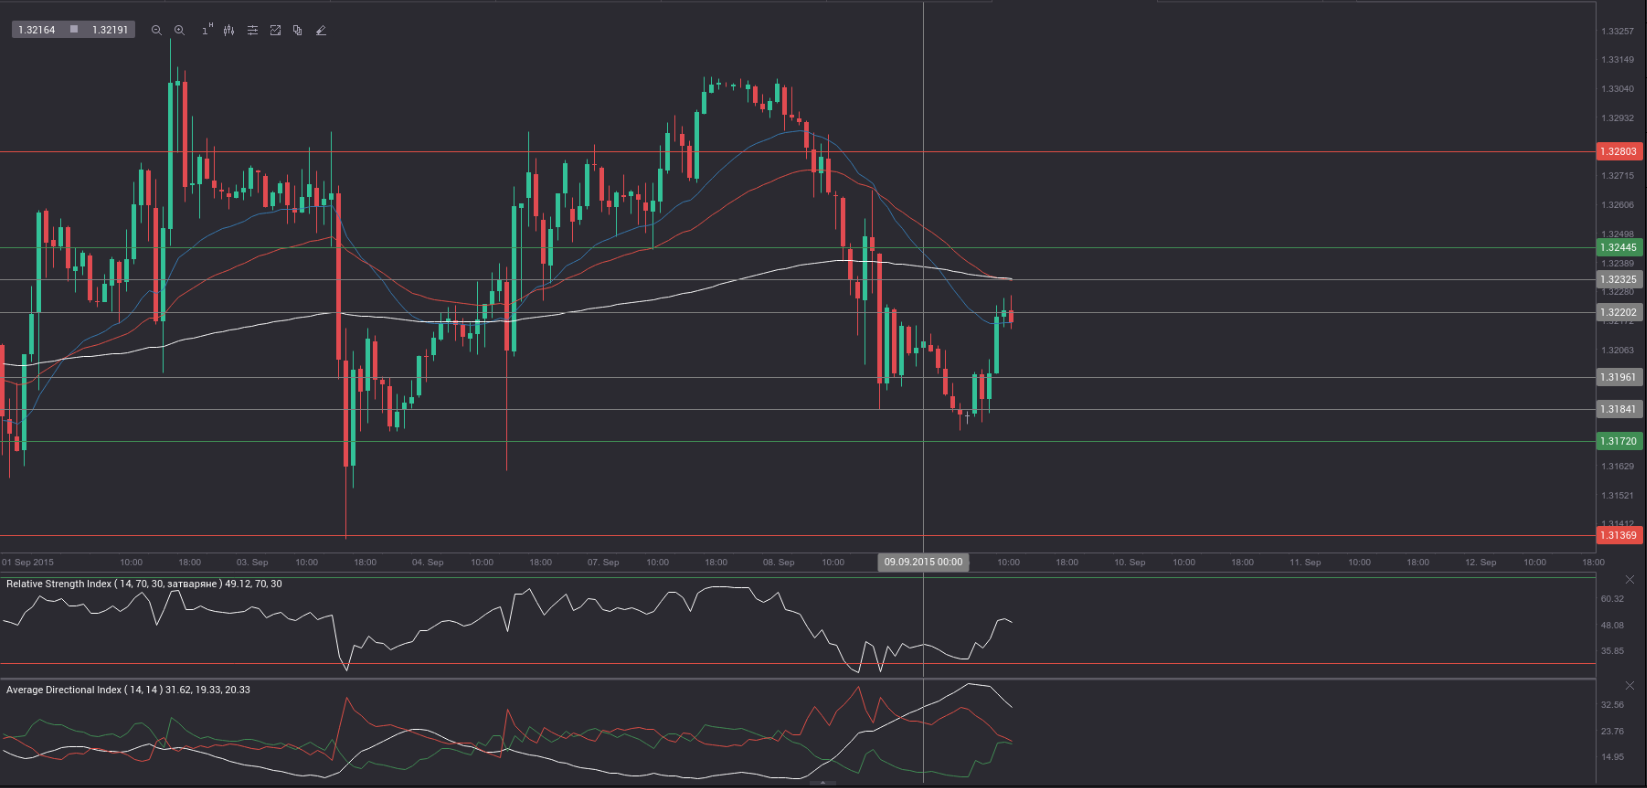
By employing the Camarilla calculation method, the daily pivot levels for USD/CAD are presented as follows:
R1 – 1.3220
R2 – 1.3232
R3 (range resistance – green on the 1-hour chart) – 1.3244
R4 (range breakout – red on the 1-hour chart) – 1.3280
S1 – 1.3196
S2 – 1.3184
S3 (range support – green on the 1-hour chart) – 1.3172
S4 (range breakout – red on the 1-hour chart) – 1.3136
By using the traditional method of calculation, the weekly pivot levels for USD/CAD are presented as follows:
Central Pivot Point – 1.3242
R1 – 1.3371
R2 – 1.3458
R3 – 1.3587
S1 – 1.3155
S2 – 1.3026
S3 – 1.2939