Yesterday’s trade saw USD/JPY within the range of 123.31-124.17. The pair closed at 123.41, down 0.32% on a daily basis and extending losses from Wednesday. The daily low has also been the lowest level since July 29th, when the cross registered a low of 123.30.
At 7:41 GMT today USD/JPY was down 0.44% for the day to trade at 122.88. The pair overcame the lower range breakout level (S4), as it touched a daily low at 122.81 at 3:05 GMT. It has been the lowest level since July 13th, when a daily low of 122.00 was reached. Support may be received within the 122.50-122.75 area.
Today the cross may be influenced by a number of macroeconomic reports as listed below.
Fundamentals
United States
Manufacturing PMI by Markit – preliminary estimate
Manufacturing activity in the United States probably increased a second consecutive month in August, with the corresponding preliminary Purchasing Managers Index coming in at a reading of 54.0, according to market expectations. In July the final seasonally adjusted PMI stood at 53.8, while being in line with the preliminary reading.
According to Markits statement: ”Stronger rates of output and new business growth were the main factors boosting the headline PMI reading in July. Production volumes expanded at the sharpest pace for three months, with survey respondents generally citing improved domestic demand conditions. Moreover, manufacturers commented on continued investments in new products and efforts to boost operating capacity, while some suggested that reshoring strategies had also provided a tailwind to growth at their plants.”
”…new business levels expanded at a strong pace that was the fastest recorded for four months. The latest survey also pointed to an increase in new export sales, which contrasted with the declines seen in each of the previous three months. However, the rate of new export order growth was only marginal, with some manufacturers noting that the strong dollar and an improving U.S. economy had encouraged them to focus sales efforts on domestic markets. July data pointed to a solid increase in payroll numbers, which continued the upward trend seen through much of the past five-and-a-half years.”
Values above the key level of 50.0 indicate optimism (expanding activity). In case the flash manufacturing PMI showed a better-than-anticipated performance, this would have a moderate bullish effect on the US dollar. The preliminary data by Markit Economics is due out at 13:45 GMT.
Bond Yield Spread
The yield on Japanese 2-year government bonds went as high as 0.008% on August 20th, or matching the high levels registered during the prior two trading days, after which it slid to 0.006% at the close to gain 0.001 percentage point on a daily basis.
The yield on US 2-year government bonds climbed as high as 0.682% on August 20th, after which it fell to 0.665% at the close to add 0.004 percentage point for the day.
The spread between 2-year US and 2-year Japanese bond yields, which reflects the flow of funds in a short term, widened to 0.659% on August 20th from 0.654% during the prior day. The August 20th yield spread has been the largest one since August 18th, when the difference was 0.715%.
Meanwhile, the yield on Japans 10-year government bonds soared as high as 0.378% on August 20th, after which it slid to 0.375% at the close to lose 0.002 percentage point compared to August 19th.
The yield on US 10-year government bonds climbed as high as 2.134% on August 20th, after which it slipped to 2.078% at the close to lose 5.1 basis points (0.051 percentage point) on a daily basis, while marking a second consecutive day of decrease.
The spread between 10-year US and 10-year Japanese bond yields narrowed to 1.703% on August 20th from 1.752% during the prior day. The August 20th yield difference has been the lowest one in more than three months.
Daily and Weekly Pivot Levels
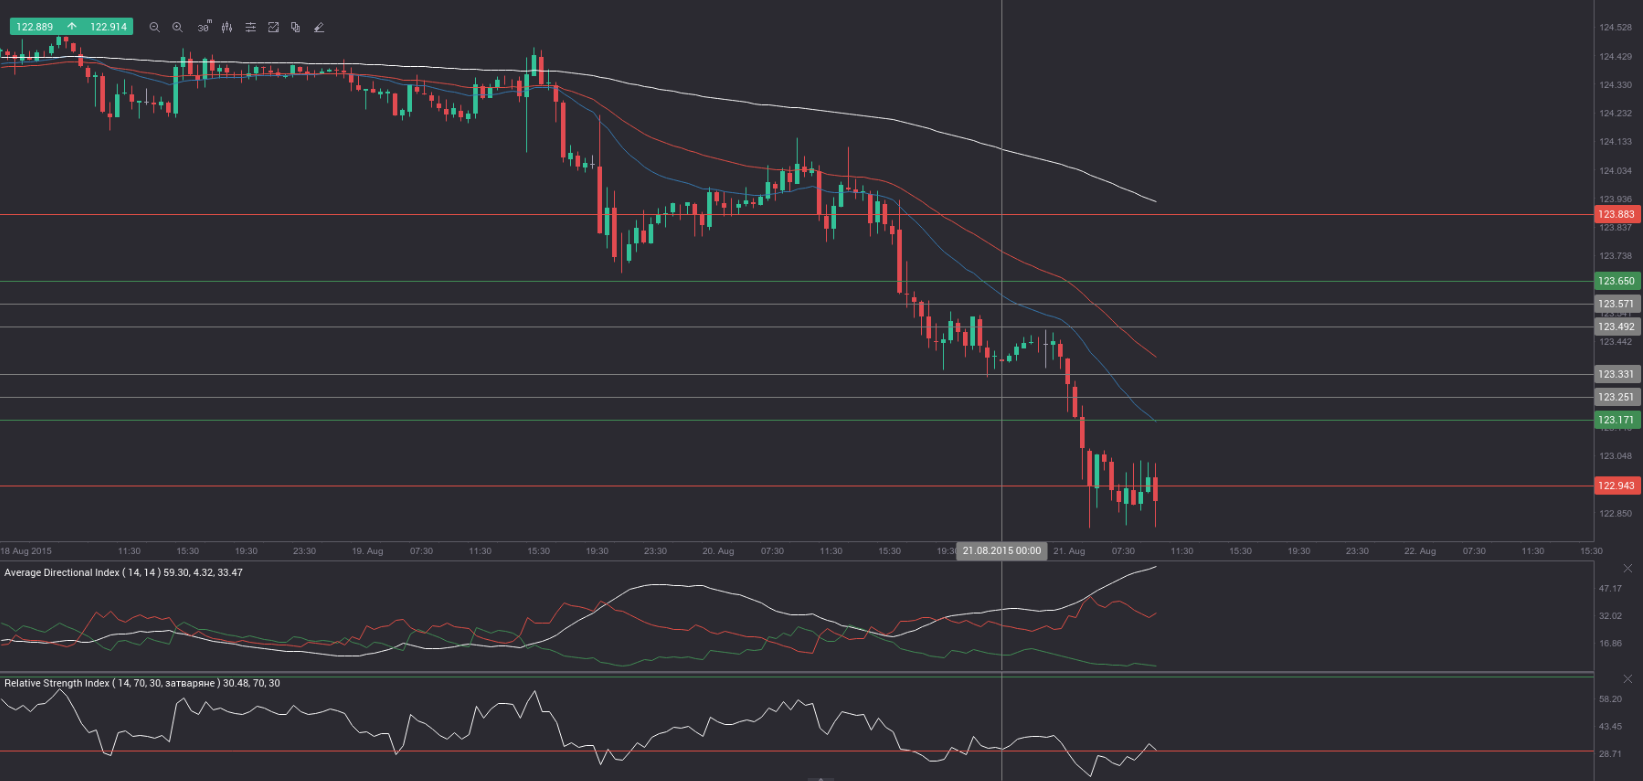
By employing the Camarilla calculation method, the daily pivot levels for USD/JPY are presented as follows:
R1 – 123.49
R2 – 123.57
R3 (range resistance – green on the 30-minute chart) – 123.65
R4 (range breakout – red on the 30-minute chart) – 123.88
S1 – 123.33
S2 – 123.25
S3 (range support – green on the 30-minute chart) – 123.17
S4 (range breakout – red on the 30-minute chart) – 122.94
By using the traditional method of calculation, the weekly pivot levels for USD/JPY are presented as follows:
Central Pivot Point – 124.46
R1 – 125.15
R2 – 125.99
R3 – 126.68
S1 – 123.62
S2 – 122.93
S3 – 122.09