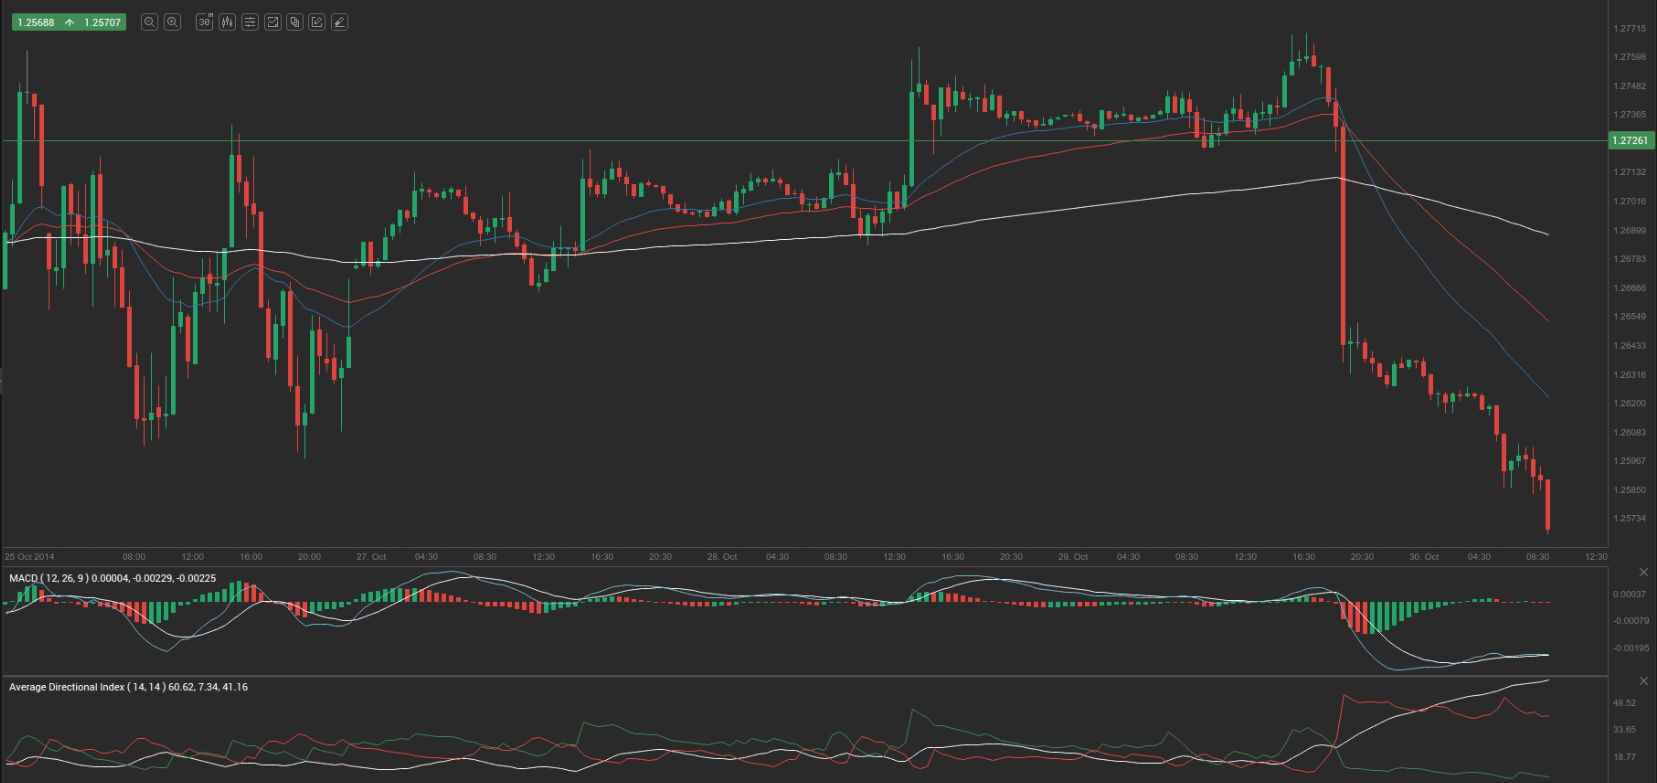
Yesterday’s trade saw EUR/USD within the range of 1.2629-1.2772. The pair closed at 1.2632, losing 0.80% on a daily basis.
At 7:53 GMT today EUR/USD was down 0.35% for the day to trade at 1.2589. The pair broke the first key daily and the first key weekly support levels to touch a daily low at 1.2569 at 8:06 GMT.
Fundamentals
Euro zone
German unemployment
The number of the unemployed people in Germany probably increased by 5 000 in October, according to the median forecast by experts, following an increase by 13 000 during September. The latter has been the sharpest since May. An increase implies that consumer spending may be less active, while the latter is tightly related to economic growth. A decrease suggests the opposite.
At the same time, the seasonally adjusted rate of unemployment in the country probably remained unchanged at 6.7% in October, a rate reported in the past eight months.
In case the number of the unemployed rose more than projected and the unemployment rate increased, this would have a bearish effect on the euro. The Federal Statistics Office will release the official data at 8:55 GMT.
Euro zone Economic Sentiment Indicator
Confidence among consumers in the Euro area probably remained little changed in October. The final value of the consumer confidence index probably confirmed the preliminary estimate of -11.1, which was reported on October 23rd. The final reading for September came in at -11.4. The indicator measures consumer confidence on a scale of -100 to +100. A reading of -100 suggests a lack of confidence, zero means neutrality and a reading of +100 indicates extreme levels of confidence. The index reflects the level of optimism, which consumers have about economic development in the region. The Business and Consumer Survey is conducted by phone and includes 23 000 households in the Euro zone. The questions asked stress on current economic and financial situation, savings intention and also on expected developments regarding consumer price indexes, general economic situation and major purchases of durable goods. This indicator is one of the five major components, that comprise the Economic Sentiment Indicator (ESI).
The ESI probably slipped to 99.7 in October, according to expectations, from a reading of 99.9 in September. If so, this would be the lowest ESI level since November 2013, when the index stood at 98.5. The Economic Sentiment Indicator (ESI) is a composite indicator, consisting of five sectoral confidence indicators with different weights: Industrial confidence indicator, Services confidence indicator, Consumer confidence indicator, Construction confidence indicator, Retail trade confidence indicator. The ESI is calculated as an index with mean value of 100.0 and standard deviation of 10 over a fixed standardised sample period.
Lower confidence usually implies lesser willingness to spend, including large-ticket purchases, while consumer spending is a key factor behind economic growth. Therefore, in case the ESI dropped more than anticipated, this would cause a bearish impact on the euro. The European Commission is expected to release the official reading at 10:00 GMT.
German consumer inflation – preliminary estimate
German preliminary annualized consumer inflation probably accelerated to 0.9% during the current month, according to the median forecast by analysts, from 0.8% in September. The latter has been the lowest level since February 2010. Energy prices dropped at an annualized rate of 2.2% in September. Prices were down in particular for mineral oil products (–5.1%), of which heating oil (–7.9%) and motor fuels (–4.1%). Prices of solid fuels fell 2.0% compared to September last year. Electricity prices, however, rose at an annualized rate of 1.8%. Food prices increased 0.9% compared to September 2013. The cost of services rose above average (+1.5%) compared to September last year, mostly due to the increase in net rents exclusive of heating expenses (+1.4%), on which households spend roughly a fifth of their consumption expenditure, according to the report by Destatis.
The Consumer Price Index (CPI) presents a general picture of the price change in the country, while encompassing all household types, all regions and all goods and services demanded (food, clothing, automobiles, rental, repair and hairdressing services etc). The index is based on a basket of goods and services, which is regularly renewed, so that goods and services, purchased more often by consumers, are included in the present survey.
Nations preliminary annualized CPI, evaluated in accordance with the harmonized methodology, probably also increased to 0.9% in October, after being at 0.8% in July, August and September. This methodology is used for the sake of consumer inflation comparison in an international context (member-countries in the Euro area). In case the CPI exceeded expectations and approached the 2-percent inflation objective, set by the European Central Bank, this would certainly provide support to the euro. Destatis is scheduled to publish the CPI report at 13:00 GMT.
United States
Initial, Continuing jobless claims
The number of people in the United States, who filed for unemployment assistance for the first time during the week ended on October 24th, probably dropped to 282 000 from 283 000 in the prior week. The 4-week moving average, an indicator lacking seasonal effects, was 281 000, a decrease of 3 000 from the previous weeks revised average. This has been the lowest level for this average since May 6th 2000, when it was reported at 279 250. The previous weeks average was revised up by 500 from 283 500 to 284 000.
Initial jobless claims number is a short-term indicator, reflecting lay-offs in the country. In case the number of claims decreased more than projected, this would have a bullish effect on the greenback.
The number of continuing jobless claims probably dropped to the seasonally adjusted 2 350 000 during the week ended on October 17th, from 2 351 000 in the previous week. The latter was a decrease by 38 000 compared to the unrevised level of 2 389 000, reported during the week ended on October 3rd. This has been the lowest level for insured unemployment since December 23rd 2000, when it was reported at 2 340 000. This indicator represents the actual number of people unemployed and currently receiving unemployment benefits, who filed for unemployment assistance at least two weeks ago.
The Department of Labor is to release the weekly report at 12:30 GMT.
Gross Domestic Product – preliminary estimate
The preliminary estimate of the US Gross Domestic Product probably pointed to an annualized rate of growth of 3.0% in the third quarter of the year. The final GDP estimate for Q2, reported on September 26th, pointed to an annual growth of 4.6%. The latter has been the highest growth rate in 2 ½ years, supported by business investment and a larger-than-projected increase in exports. Real personal consumption expenditures rose 2.5% in the second quarter of the year, compared with an increase of 1.2% in Q1. Real nonresidential fixed investment increased 9.7% in the second quarter, following another increase by 1.6% in the prior quarter. Real exports of goods and services expanded 11.1% in the second quarter, in contrast to a decrease of 9.2% in Q1, while real federal government consumption expenditures and gross investment dropped 0.9% in the second quarter, in comparison with a 0.1% dip in the previous quarter, according to data by the US Department of Commerce.
The report on GDP holds a lot of weight for traders, operating in the Foreign Exchange Market, as it serves as evidence of growth in a productive economy, or as evidence of contraction in an unproductive one. As a result, currency traders will look for higher rates of growth as a sign that interest rates will follow the same direction. Higher interest rates will attract more investors, which will increase demand for the US dollar. If an economy is experiencing a robust rate of growth, the benefits will eventually affect the end consumer, because of the increased likelihood of spending. Furthermore, through increased consumer expenditures the economy has the potential to expand even more. In case the preliminary GDP estimate outpaced expectations, this would certainly heighten the appeal of the greenback. The official data is due out at 12:30 GMT.
Pivot Points
According to Binary Tribune’s daily analysis, the central pivot point for the pair is at 1.2678. In case EUR/USD manages to breach the first resistance level at 1.2726, it will probably continue up to test 1.2821. In case the second key resistance is broken, the pair will probably attempt to advance to 1.2869.
If EUR/USD manages to breach the first key support at 1.2583, it will probably continue to slide and test 1.2535. With this second key support broken, the movement to the downside will probably continue to 1.2440.
The mid-Pivot levels for today are as follows: M1 – 1.2488, M2 – 1.2559, M3 – 1.2631, M4 – 1.2702, M5 – 1.2774, M6 – 1.2845.
In weekly terms, the central pivot point is at 1.2707. The three key resistance levels are as follows: R1 – 1.2803, R2 – 1.2934, R3 – 1.3030. The three key support levels are: S1 – 1.2576, S2 – 1.2480, S3 – 1.2349.