Yesterday’s trade saw USD/ILS within the range of 3.7208-3.7498. The pair closed at 3.7413, gaining 0.17% on a daily basis.
At 7:13 GMT today USD/ILS was up 0.13% for the day to trade at 3.7460. The pair touched a daily high at 3.7475 at 7:10 GMT.
Fundamentals
United States
The annualized index of consumer prices (CPI) in the United States probably decelerated to 1.6% in September, according to market expectations, from 1.7% in August. If so, this would be the third consecutive month of slowdown. In monthly terms, the CPI probably remained flat in September, following a 0.2% drop in the prior month, which has been the first in 16 months. In August prices of food and shelter rose, but the increases were more than offset by a decline in energy prices. The latter dropped at an annualized rate of 2.6% in August, while gasoline prices alone declined 4.1%.
The CPI is based on a basket of goods and services bought and used by consumers on a daily basis. In the United States the Bureau of Labor Statistics (BLS) surveys the prices of 80 000 consumer items in order to calculate the index. The latter reflects prices of commonly purchased items by primarily urban households, which represent about 87% of the US population. The Bureau processes price data from 23 000 retail and service businesses.
The CPI includes sales taxes, but excludes income taxes, costs of investments such as stocks and bonds and sales prices of homes.
The annualized Core CPI, which excludes prices of food and energy, probably remained unchanged at 1.7% in September. It is usually reported as a seasonally adjusted figure, because consumer patterns are widely fluctuating in dependance on the time of the year. The Core CPI is a key measure, because this is the gauge, which the Federal Reserve Bank examines in order to adjust its monetary policy. The Fed uses the core CPI, because prices of food, oil and gas are highly volatile and central bank’s tools are slow-acting. In case, for example, prices of oil surge considerably, this could lead to a high rate of inflation, but the central bank will not take action until this increase affects prices of other goods and services.
If the CPI tends to approach or comes in line with the inflation objective, set by the Federal Reserve and considered as providing price stability, or 2%, this will usually support demand for the US dollar. However, quite high rates of inflation (well above central bank’s inflation target) can be harmful to economy and as a result, this may lead to the loss of confidence in the local currency.
The Bureau of Labor Statistics is to release the official CPI report at 12:30 GMT.
Israel
The deficit on Israels balance of trade probably contracted to 2.200 billion USD in September, according to expectations, from a deficit figure of 2.248 billion USD in August. The latter has been the most considerable deficit since October 2012, when Israel had a record high trade deficit.
The trade balance, as an indicator, measures the difference in value between a country’s exported and imported goods and services during the reported period. It reflects the net export of goods and services, or one of the components to form the nations Gross Domestic Product. Generally, exports reflect economic growth, while imports indicate strength of domestic demand. In case the trade balance deficit contracted more than anticipated, this would have a bullish effect on the shekel. The Bank of Israel is expected to release the official trade data at 10:00 GMT.
Pivot Points
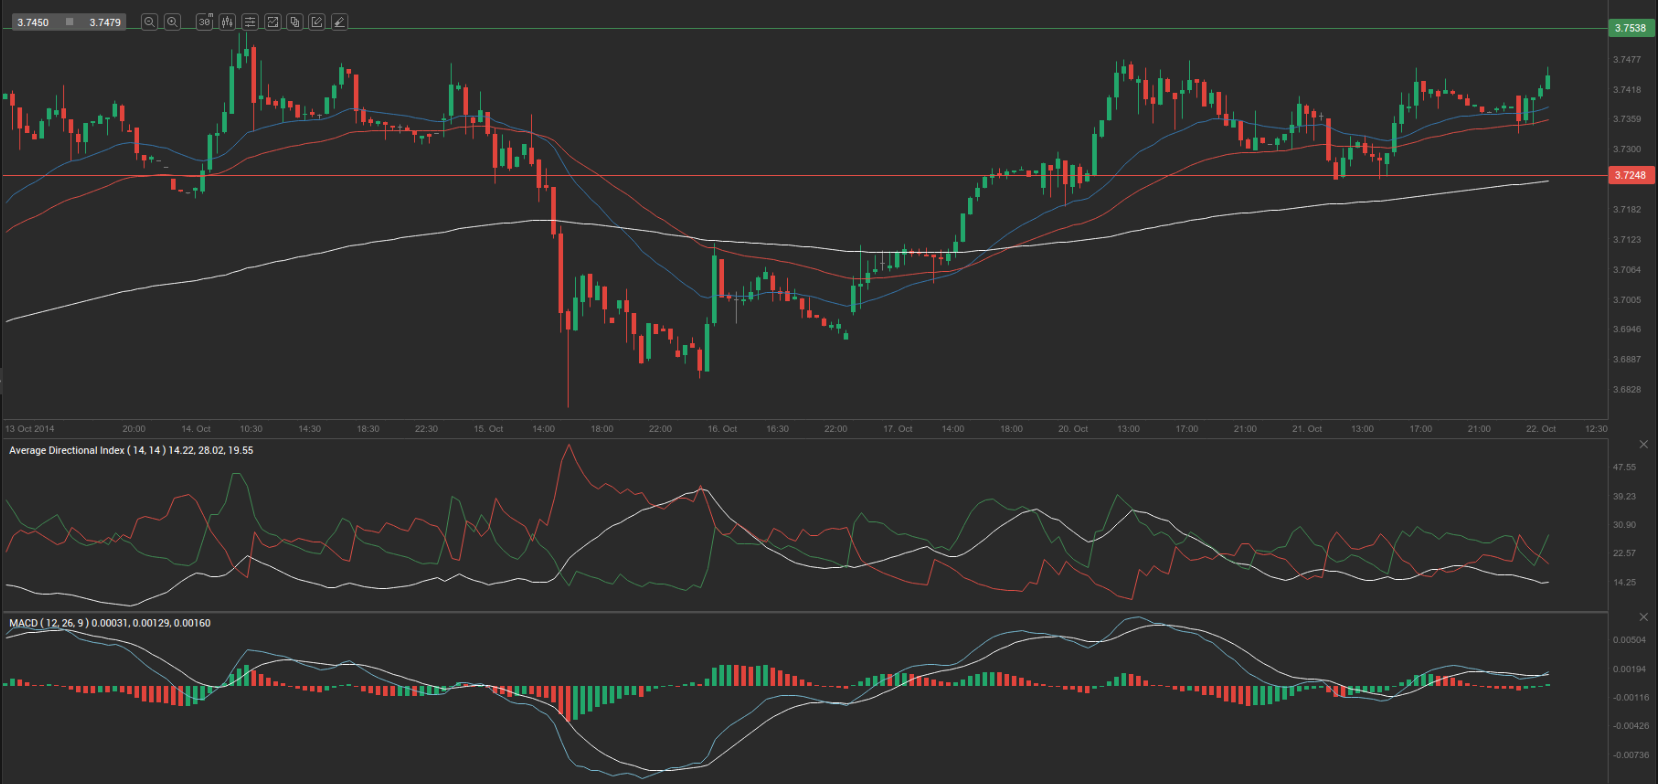
According to Binary Tribune’s daily analysis, the central pivot point for the pair is at 3.7373. In case USD/ILS manages to breach the first resistance level at 3.7538, it will probably continue up to test 3.7663. In case the second key resistance is broken, the pair will probably attempt to advance to 3.7828.
If USD/ILS manages to breach the first key support at 3.7248, it will probably continue to slide and test 3.7083. With this second key support broken, the movement to the downside will probably continue to 3.6958.
The mid-Pivot levels for today are as follows: M1 – 3.7021, M2 – 3.7166, M3 – 3.7311, M4 – 3.7456, M5 – 3.7601, M6 – 3.7746.
In weekly terms, the central pivot point is at 3.7207. The three key resistance levels are as follows: R1 – 3.7665, R2 – 3.8042, R3 – 3.8500. The three key support levels are: S1 – 3.6830, S2 – 3.6372, S3 – 3.5995.