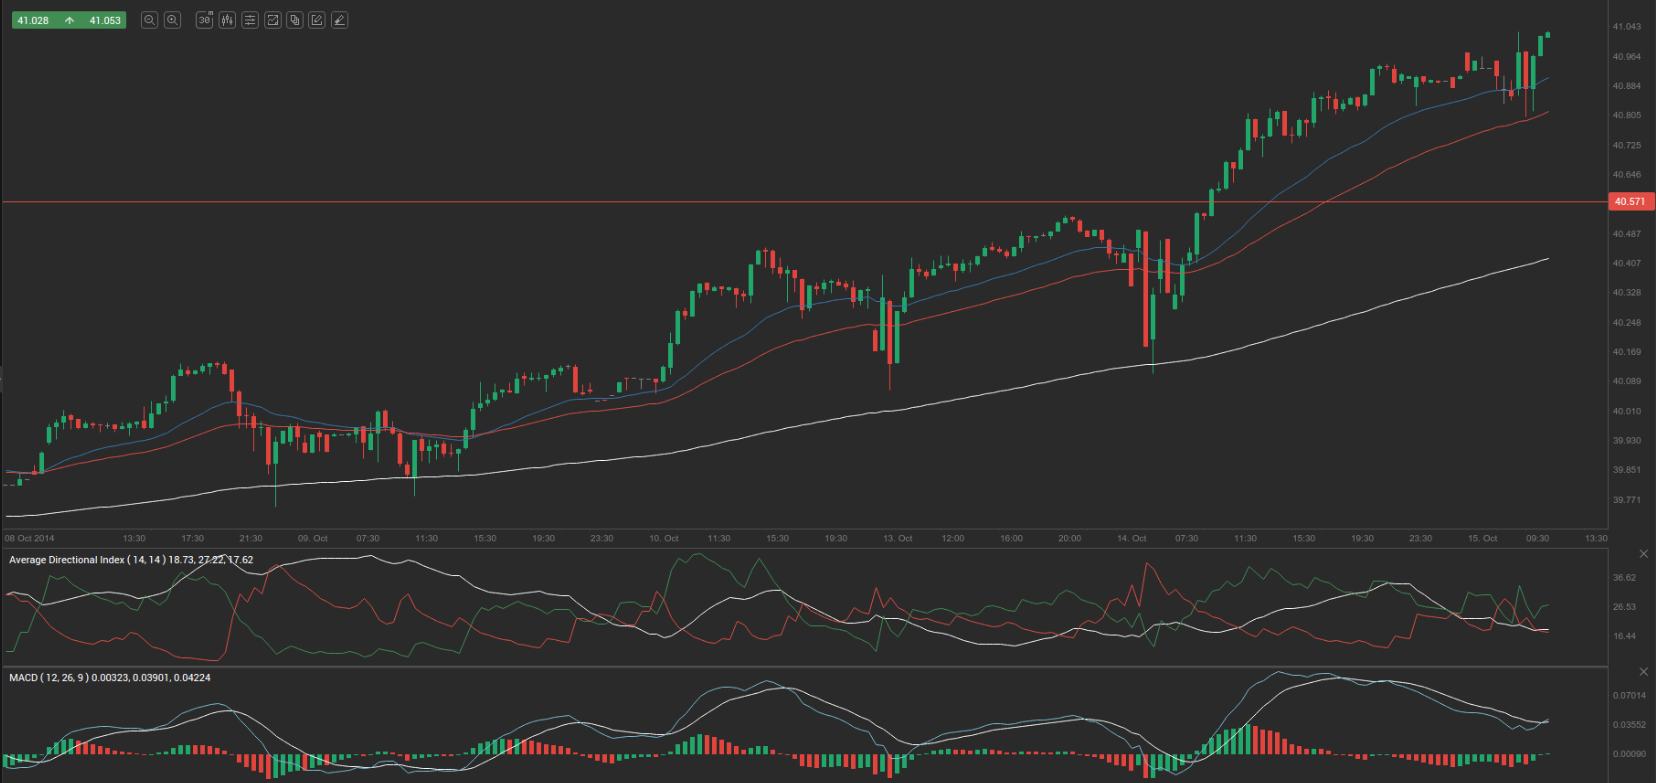
Yesterday’s trade saw USD/RUB within the range of 40.415-40.979. The pair closed at 40.929, gaining 1.23% on a daily basis.
At 8:04 GMT today USD/RUB was up 0.18% for the day to trade at 41.030. The pair broke the first and the second key weekly resistance levels and touched a daily high and also a fresh all-time high at 41.044 at 8:02 GMT.
Fundamentals
United States
Retail Sales
Retail sales in the United States probably dropped 0.1% in September on a monthly basis, according to the median forecast by experts. In August retail sales rose 0.6% to reach 444.4 billion USD, supported by stronger sales of automobiles. Retail sales in motor vehicles stores were up 1.5% in August, sales in building material and garden suppliers increased 1.4%, while those in sporting stores were 0.9% higher. On the other hand, sales in general merchandise stores dipped 0.1%, while sales in gasoline stations were 0.8% lower.
Annualized retail sales climbed 5.0% in August, following a 4.2% gain in July.
The report on retail sales reflects the dollar value of merchandise sold within the retail trade by taking a sampling of companies, operating in the sector of selling physical end products to consumers. The retail sales report encompasses both fixed point-of-sale businesses and non-store retailers, such as mail catalogs and vending machines. US Census Bureau, which is a part of the Department of Commerce surveys about 5 000 companies of all sizes, from huge retailers such as Wal-Mart to independent small family firms.
US core retail sales, or retail sales ex autos, probably rose 0.3% in September compared to a month ago, following another 0.3% gain in August. This indicator removes large ticket prices and historical seasonality of automobile sales.
The retail sales index is considered as a coincident indicator, thus, it reflects the current state of the economy. It is also considered a pre-inflationary indicator, which investors can use in order to reassess the probability of an interest rate hike or cut by the Federal Reserve Bank. In addition, this indicator provides key information regarding consumer spending trends. Consumer expenditures, on the other hand, account for almost two-thirds of nation’s overall Gross Domestic Product. Therefore, a larger than expected decrease in sales would mount selling pressure on the US dollar. The official report is due out at 12:30 GMT.
Producer prices
The annualized index of producer prices (PPI) probably remained steady at 1.8% in September, according to market expectations. This index reflects the change in prices of over 8 000 products, sold by manufacturers during the respective period. The PPI differs from the CPI, which measures the change in prices from consumer’s perspective, due to subsidies, taxes and distribution costs of different types of manufacturers in the country. In case producers are forced to pay more for goods and services, they are more likely to pass these higher costs to the end consumer. Therefore, the PPI is considered as a leading indicator of consumer inflation. Higher than expected producer prices would have a bullish effect on the greenback.
Nation’s annualized core PPI, which excludes prices of volatile categories such as food and energy, probably also remained steady at 1.8% in September. This indicator is quite sensitive to changes in aggregate demand, thus, it can be used as a leading indicator for economy. However, because of its restrained scope, it is not suitable for future inflation forecasts. The Bureau of Labor Statistics is expected to publish the official PPI readings at 12:30 GMT.
New York Empire State Manufacturing data
The New York Empire State Manufacturing Index probably fell to a reading of 20.80 in September, according to the median forecast by experts, from 27.54 in the prior month. The latter has been the highest reading since April 2010.
The index is based on the monthly Empire State Manufacturing Survey, which is conducted by the Federal Reserve Bank of New York. About 200 top manufacturing executives respond to a questionnaire, sent out during the first day of the month. They provide their estimates in regard to the performance of several business indicators from the prior month, while also forecasting performance during the upcoming six months.
The ”general business conditions” component of the index is based on a distinct question, posed on the Empire State Manufacturing Survey, which means it is not a weighted average of the other indicators. These indicators, which are only applicable to the manufacturing facilities of survey respondents in the region of New York, include new orders, shipments, unfilled orders, delivery time, inventories, prices paid, prices received, number of employees including contract workers, average employee work week, technology spending and capital expenditures.
The general business conditions component and the sub-indexes for the 11 indicators are calculated by subtracting the percentage of respondents, rating an indicator as ”lower” (a drop), from the percentage of respondents, rating the same indicator as ”higher” (an increase). In case 33% of survey respondents stated that business conditions had improved during the current month, 50% stated that conditions had not changed, and 17% of the respondents stated that conditions had deteriorated, the index would have a reading of 16. Readings above 0.00 are indicative of improving business conditions in the region. Higher than anticipated results would certainly boost demand for the US dollar. The Federal Reserve Bank of New York is expected to release the official index reading at 12:30 GMT.
”Beige Book”
At 18:00 GMT the Federal Reserve is to release its “Beige Book” report. It is published eight times during the year. Each of the banks in the 12 Federal Reserve Districts gathers data in regard to current economic situation in the country on the basis of interviews with key business contacts, economists, market experts, and other sources. In case the Beige Book presents an optimistic economic outlook, this will usually support the greenback, while a pessimistic view will have a bearish effect on the currency.
Russian Federation
Producer prices
Annualized producer prices in the country probably increased 4.50% in September, according to expectations. In August producer prices climbed at an annualized rate of 5.70%, which has been the slowest since March. In monthly terms, the Producer Price Index (PPI) remained flat in August. This index measures the average change over time in the selling prices, received by domestic producers for their output. The PPI differs from the CPI, which measures the change in prices from consumer’s perspective. As the producer price index reflects prices of consumer goods and capital equipment, a portion of the inflation at the producer level is usually passed through to the consumer price index (CPI).
Traders and market analysts consider the PPI for finished goods as a precursor of consumer price inflation. In case the prices, which manufacturers pay for their raw materials, surge, producers would have to increase the prices, which consumers pay for their finished goods, in order to sustain their profit margins. Slower than expected rate of increase in producer prices will usually have a bearish effect on the national currency. The PPI data is due out at 12:00 GMT.
Industrial output
Russias annualized industrial production probably expanded 0.3% in September, according to market expectations. In August production index remained flat, which followed six consecutive months of expansion. The index reflects the change in overall inflation-adjusted value of output in sectors such as manufacturing, mining and utilities. In case industrial output expanded more than anticipated, this might have a bullish effect on the ruble. The Federal State Statistics Service will release the official industrial data at 12:00 GMT.
Pivot Points
According to Binary Tribune’s daily analysis, the central pivot point for the pair is at 40.774. In case USD/RUB manages to breach the first resistance level at 41.134, it will probably continue up to test 41.338. In case the second key resistance is broken, the pair will probably attempt to advance to 41.698.
If USD/RUB manages to breach the first key support at 40.571, it will probably continue to slide and test 40.210. With this second key support broken, the movement to the downside will probably continue to 40.006.
The mid-Pivot levels for today are as follows: M1 – 40.108, M2 – 40.390, M3 – 40.672, M4 – 40.954, M5 – 41.236, M6 – 41.518.
In weekly terms, the central pivot point is at 40.165. The three key resistance levels are as follows: R1 – 40.679, R2 – 40.992, R3 – 41.506. The three key support levels are: S1 – 39.852, S2 – 39.338, S3 – 39.025.