Yesterday’s trade saw USD/MXN within the range of 13.2300-13.3210. The pair closed at 13.3175, gaining 0.30% on a daily basis.
At 8:41 GMT today USD/MXN was down 0.25% for the day to trade at 13.2839. The pair touched a daily low at 13.2708 at 7:30 GMT.
Fundamental view
United States
Sales of new single-family homes probably climbed 4.4% to the seasonally adjusted annual rate of 430 000 during August compared to a month ago, according to market expectations. The index of new home sales dropped 2.4% to the annual rate of 412 000 in July from 422 000 in June.
There are several points to watch out for when interpreting the New Home Sales numbers. First of all, the statistics does not record any houses that are not going to be sold immediately. As an example, the case when a house is commissioned to be built on an existing plot of land that the purchaser owns.
Second, the statistics are taken at the point where a customer has signed a sales contract or has put a deposit down. At this point the house can be at any stage of construction.
Third, the sales figures are not adjusted to take into account the sales contracts, which are eventually canceled by the builder or the customer. However, the same house is not included in any subsequent count when it is eventually sold to another customer.
This report has a significant influence on the Forex market, because increasing new home sales can lead to a rise in consumption, for example. The new home sales index is also an excellent indicator of any economic downturns or upturns due to the sensitivity of consumers income. When, for instance, new home sales drop over several months, this usually is a precursor to an economic depression.
Therefore, in case the index rose more than anticipated, this would usually boost demand for the greenback. The US Census Bureau is to report the official figure at 14:00 GMT.
Technical view
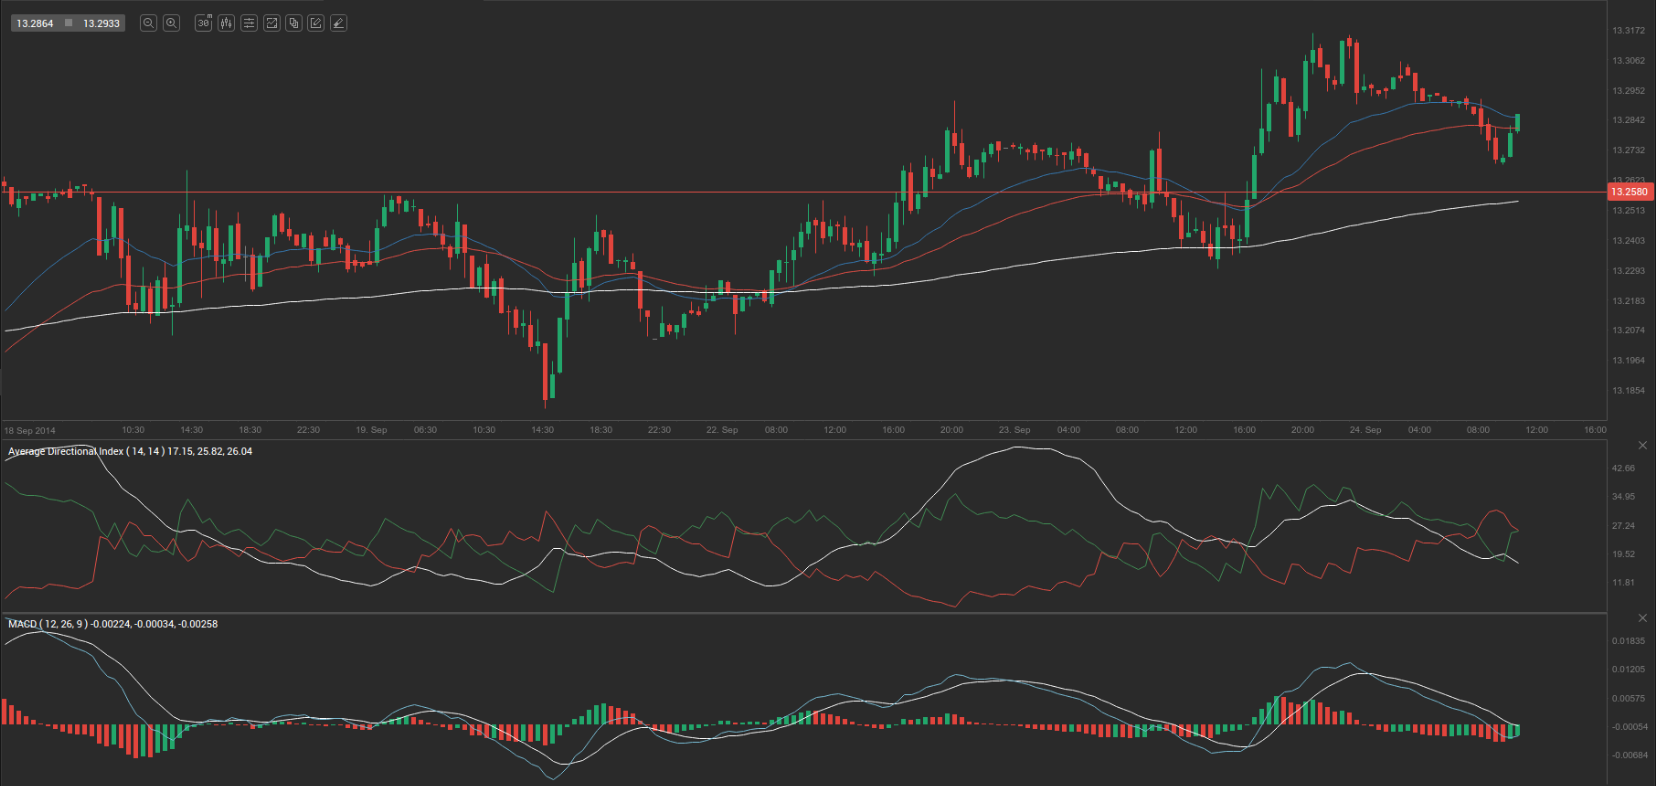
According to Binary Tribune’s daily analysis, the central pivot point for the pair is at 13.2895. In case USD/MXN manages to breach the first resistance level at 13.3490, it will probably continue up to test 13.3805. In case the second key resistance is broken, the pair will probably attempt to advance to 13.4400.
If USD/MXN manages to breach the first key support at 13.2580, it will probably continue to slide and test 13.1985. With this second key support broken, the movement to the downside will probably continue to 13.1670.
The mid-Pivot levels for today are as follows: M1 – 13.1828, M2 – 13.2283, M3 – 13.2738, M4 – 13.3193, M5 – 13.3648, M6 – 13.4103.
In weekly terms, the central pivot point is at 13.2041. The three key resistance levels are as follows: R1 – 13.2858, R2 – 13.3607, R3 – 13.4424. The three key support levels are: S1 – 13.1292, S2 – 13.0475, S3 – 12.9726.