Yesterday’s trade saw USD/CAD within the range of 1.0923-1.1019. The pair closed at 1.0999, gaining 0.26% on a daily basis.
At 8:27 GMT today USD/CAD was down 0.14% for the day to trade at 1.0988. The pair touched a daily low at 1.0986 at 8:06 GMT.
Fundamental view
United States
Initial, Continuing Jobless Claims
The number of people in the United States, who filed for unemployment assistance for the first time during the week ended on September 12th, probably dropped to 305 000 from 315 000 in the prior week. This is a short-term indicator, reflecting lay-offs in the country. In case the number of initial jobless claims decreased more than projected, this would have a bullish effect on the greenback. The Department of Labor is to release the weekly report at 12:30 GMT.
The number of continuing jobless claims probably dropped to the seasonally adjusted 2 470 000 during the week ended on September 5th, from 2 487 000 in the previous week. This indicator represents the actual number of people unemployed and currently receiving unemployment benefits, who filed for unemployment assistance at least two weeks ago.
Housing Starts and Building Permits
The number of housing starts in the United States probably declined to 1.040 million in August from the seasonally adjusted annual rate of 1.093 million during the prior month, as the latter has been the highest level since November 2013. Single-family housing starts in July were at a rate of 656 000, or 8.3% above the revised figure of 606 000 in June. The July rate for units in buildings with five units or more was 423 000, according to data by the US Census Bureau.
Housing Starts represent a gauge to measure residential units, on which construction has already begun, every month. A start in construction is defined as the foundation laying of a building and it encompasses residential housing primarily.
The number of building permits in the country probably fell to 1.045 million in August from a revised up annual level of 1.057 million in July (1.052 million previously), with the latter being the highest level since April. Single-family authorizations in July were at a rate of 640 000 or 0.9% above the revised June figure of 634 000. Authorizations of units in buildings with five units or more were at a rate of 382 000 in July, according to the Census Bureau.
Building permits are permits, issued in order to allow excavation. An increase in the number of building permits and housing starts usually occurs a few months after mortgage rates in the country have been reduced. Permits usually lead housing starts, but are not required in all regions of the United States. Building permits, as an indicator, provide information regarding demand in US housing market. A higher than anticipated number would support the greenback. The official housing data by the US Census Bureau is due out at 12:30 GMT.
Philadelphia Fed Manufacturing Index
The Philadelphia Fed Manufacturing Index probably fell to a reading of 23 in September from 28 index points during the previous month, as the latter has been the highest level since March 2011. The index is based on a monthly business survey (the Business Outlook Survey), measuring manufacturing activity in the third district of the Federal Reserve, Philadelphia. Participants give their opinion about the direction of business changes in overall economy and different indicators of activity in their companies, such as employment, working hours, new and existing orders, deliveries, inventories, delivery time, price etc. The survey is conducted every month since May 1968. The results are presented as the difference between the percentages of positive and negative projections. A level above zero is indicative of improving conditions, while a level below zero is indicative of worsening conditions. The Federal Reserve Bank of Philadelphia is expected to release the official results from the survey at 14:00 GMT. Lower-than-expected index readings would have a bearish effect on the greenback.
Canada
Foreign portfolio investment in Canadian securities probably expanded to 2.47 billion CAD in July, according to the median forecast by experts, following a drop by 1.07 billion CAD in June. This indicator reflects the flow of incoming investments in the local stock, bond and money markets. An increasing flow of foreign investments is usually related with a positive economic outlook for the country being invested in. This usually increases demand for its currency, therefore, in case portfolio investment in Canadian securities expanded more than anticipated, the loonie would receive support. The official data by Statistics Canada is due out at 12:30 GMT.
Technical view
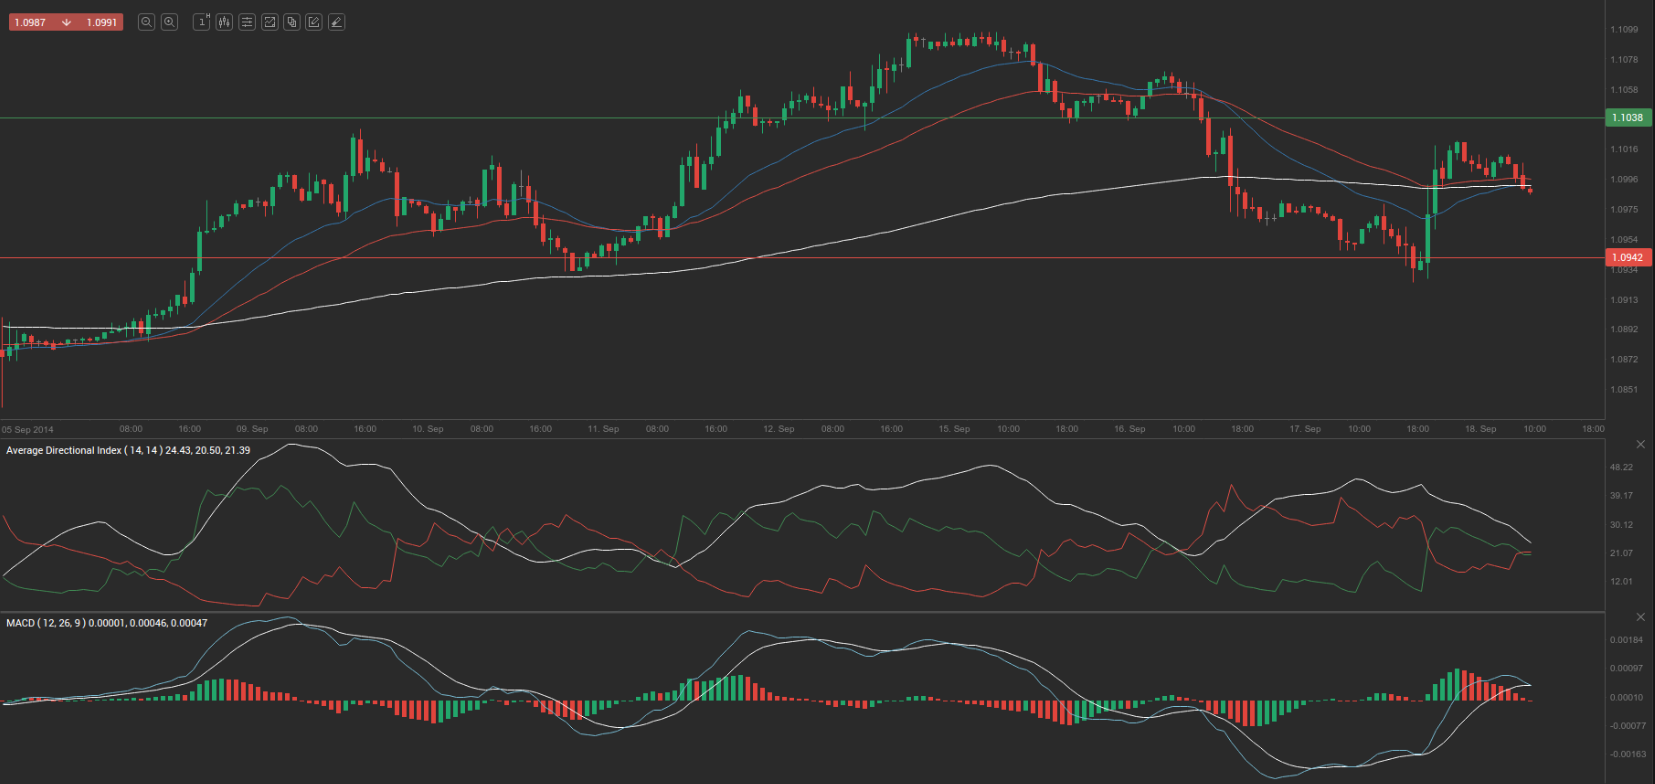
According to Binary Tribune’s daily analysis, the central pivot point for the pair is at 1.0980. In case USD/CAD manages to breach the first resistance level at 1.1038, it will probably continue up to test 1.1076. In case the second key resistance is broken, the pair will probably attempt to advance to 1.1134.
If USD/CAD manages to breach the first key support at 1.0942, it will probably continue to slide and test 1.0884. With this second key support broken, the movement to the downside will probably continue to 1.0846.
The mid-Pivot levels for today are as follows: M1 – 1.0865, M2 – 1.0913, M3 – 1.0961, M4 – 1.1009, M5 – 1.1057, M6 – 1.1105.
In weekly terms, the central pivot point is at 1.1023. The three key resistance levels are as follows: R1 – 1.1168, R2 – 1.1243, R3 – 1.1388. The three key support levels are: S1 – 1.0948, S2 – 1.0803, S3 – 1.0728.