Yesterday’s trade saw USD/CAD within the range of 1.1032-1.1098. The pair closed at 1.1056, losing 0.29% on a daily basis.
At 7:17 GMT today USD/CAD was up 0.08% for the day to trade at 1.1063. The pair touched a daily high at 1.1072 at 6:55 GMT.
Fundamental view
United States
United States’ annualized index of producer prices (PPI) probably rose to 1.8% in August, according to the median estimate by experts, from 1.7% in July. This index reflects the change in prices of over 8 000 products, sold by manufacturers during the respective period. The PPI differs from the CPI, which measures the change in prices from consumer’s perspective, due to subsidies, taxes and distribution costs of different types of manufacturers in the country. In case producers are forced to pay more for goods and services, they are more likely to pass these higher costs to the end consumer. Therefore, the PPI is considered as a leading indicator of consumer inflation. Higher than expected producer prices would have a bullish effect on the greenback.
Nation’s annualized core PPI, which excludes prices of volatile categories such as food and energy, probably accelerated 1.8% in August, following a 1.6% gain in the preceding month. This indicator is quite sensitive to changes in aggregate demand, thus, it can be used as a leading indicator for economy. However, because of its restrained scope, it is not suitable for future inflation forecasts. The Bureau of Labor Statistics is expected to publish the official PPI readings at 12:30 GMT.
Canada
Manufacturing sales in Canada probably increased 1.0% in July compared to June, according to market expectations, following another 0.6% in June. The Monthly Survey of Manufacturing features statistical data regarding sales of finished goods, inventories, unfilled orders and new orders in Canadian sector of manufacturing. About 10 500 items and 27 000 companies are encompassed.
Manufacturing sales are considered as an indicator of demand in the future. An increase in the number of goods and unsold inventories suggests, that demand is not sufficient and vice versa. On the other hand, an increase in sales (shipments) speaks of strong demand. Therefore, in case shipments rose at a higher than projected pace, this would provide support to the loonie. Statistics Canada will release the manufacturing data at 12:30 GMT.
In addition, at 16:30 GMT Bank of Canada Governor Stephen Poloz is expected to take a statement. He took office in June 2013 for a mandate of seven years.
Technical view
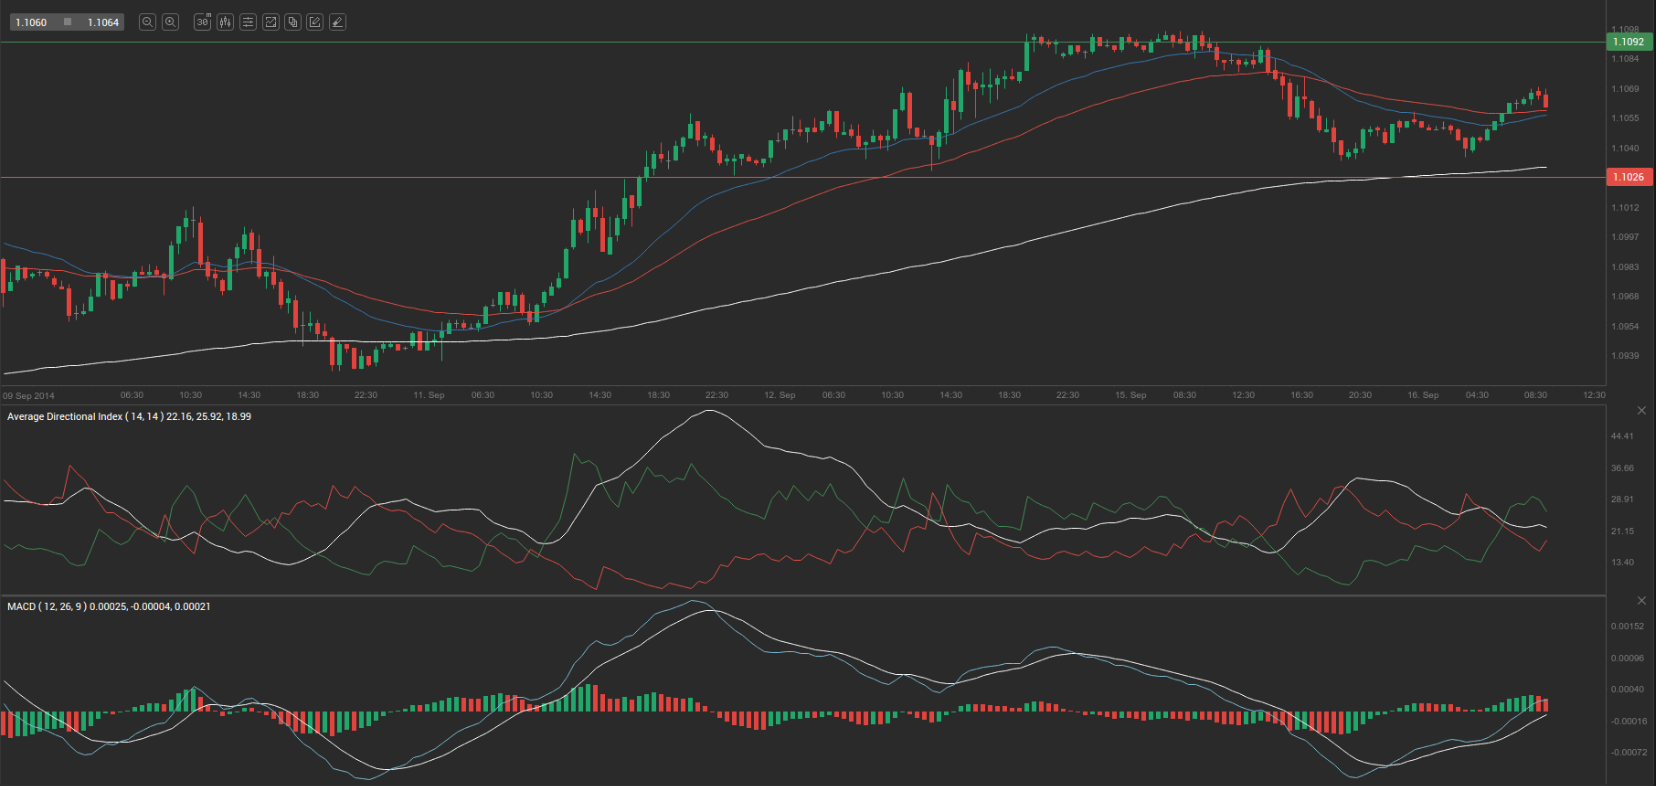
According to Binary Tribune’s daily analysis, the central pivot point for the pair is at 1.1062. In case USD/CAD manages to breach the first resistance level at 1.1092, it will probably continue up to test 1.1128. In case the second key resistance is broken, the pair will probably attempt to advance to 1.1158.
If USD/CAD manages to breach the first key support at 1.1026, it will probably continue to slide and test 1.0996. With this second key support broken, the movement to the downside will probably continue to 1.0960.
The mid-Pivot levels for today are as follows: M1 – 1.0978, M2 – 1.1011, M3 – 1.1044, M4 – 1.1077, M5 – 1.1110, M6 – 1.1143.
In weekly terms, the central pivot point is at 1.1023. The three key resistance levels are as follows: R1 – 1.1168, R2 – 1.1243, R3 – 1.1388. The three key support levels are: S1 – 1.0948, S2 – 1.0803, S3 – 1.0728.