Yesterday’s trade saw USD/MXN within the range of 13.0273-13.1410. The pair closed at 13.1385, gaining 0.78% on a daily basis.
At 7:29 GMT today USD/MXN was up 0.21% for the day to trade at 13.1646. The pair broke the first key weekly resistance level and touched a daily high at 13.1707 at 7:33 GMT.
Fundamental view
Mexico
The annualized index of consumer prices (CPI) in Mexico probably accelerated to 4.10% in August, according to the median forecast by experts, from 4.07% in July, with the latter being the highest level since February. In July costs of food and non-alcoholic beverages climbed at an annualized pace of 5.30%, prices of alcoholic beverages and tobacco rose 6.56%, transport costs increased 6.73%, while costs of education climbed 4.38%.
Key categories, included in Mexican CPI, are Non-food Goods (accounting for 19.7% of the total weight), Housing (18.7%) and Other Services (18.4%). Other categories include Food, Beverages and Tobacco (14.8%), Energy (9.5%), Products subsidized by the government (5.3%), Education (5.1%), Meat and Eggs (4.8%) and Fruits and Vegetables (3.7%).
In case the CPI rose more than projected, this would have a bullish effect on the peso. Insituto Nacional de Estadistica Y Geografia is expected to release the official report at 13:00 GMT.
Technical view
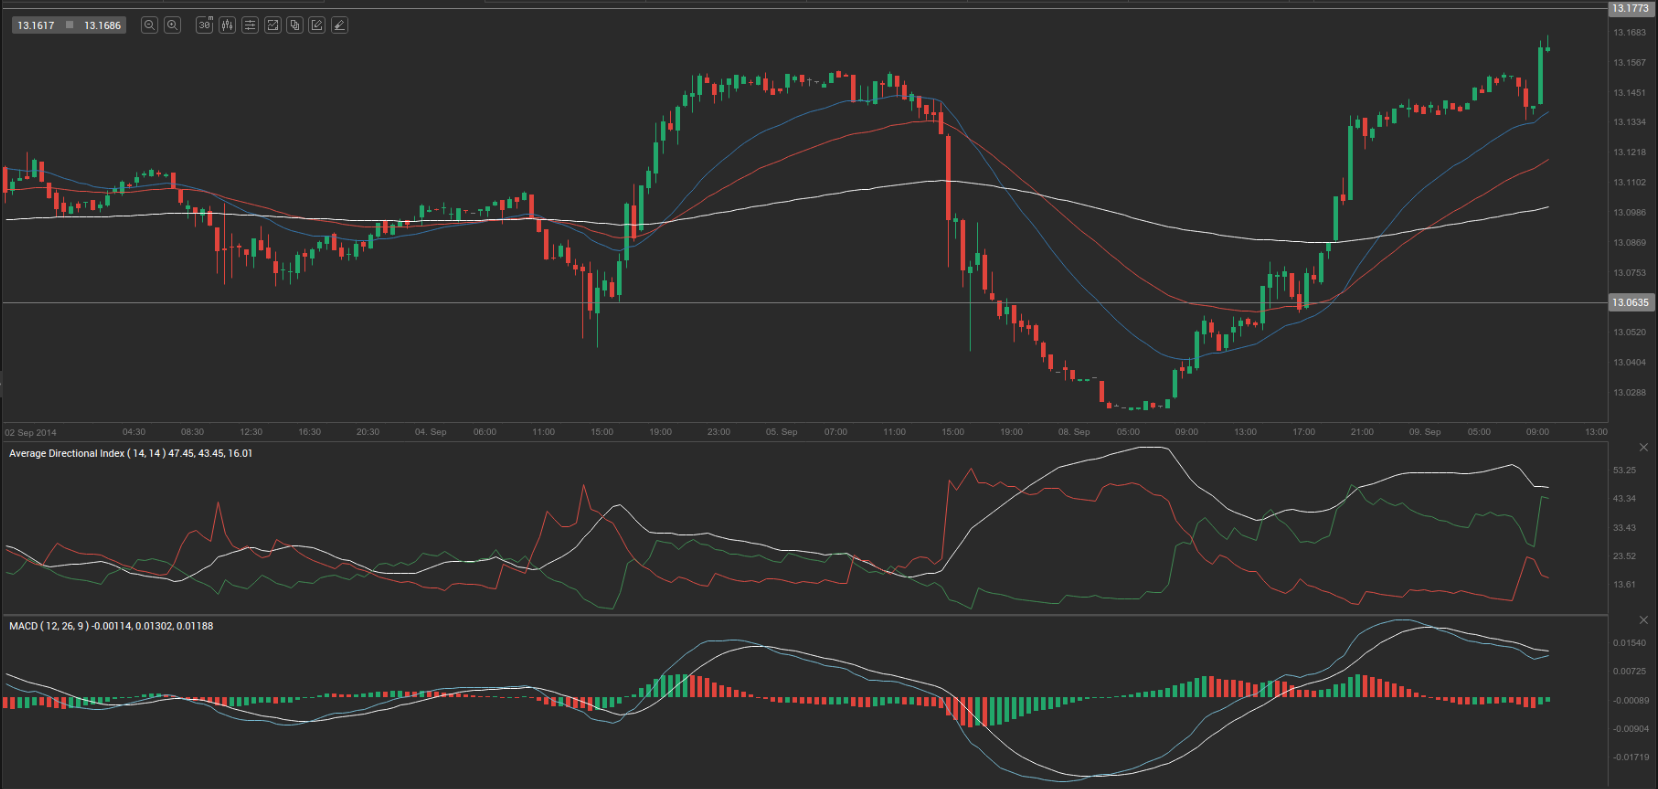
According to Binary Tribune’s daily analysis, the central pivot point for the pair is at 13.1023. In case USD/MXN manages to breach the first resistance level at 13.1773, it will probably continue up to test 13.2160. In case the second key resistance is broken, the pair will probably attempt to advance to 13.2909.
If USD/MXN manages to breach the first key support at 13.0635, it will probably continue to slide and test 12.9886. With this second key support broken, the movement to the downside will probably continue to 12.9498.
The mid-Pivot levels for today are as follows: M1 – 12.9692, M2 – 13.0261, M3 – 13.0829, M4 – 13.1398, M5 – 13.1966, M6 – 13.2535.
In weekly terms, the central pivot point is at 13.0707. The three key resistance levels are as follows: R1 – 13.1163, R2 – 13.2022, R3 – 13.2478. The three key support levels are: S1 – 12.9848, S2 – 12.9392, S3 – 12.8533.