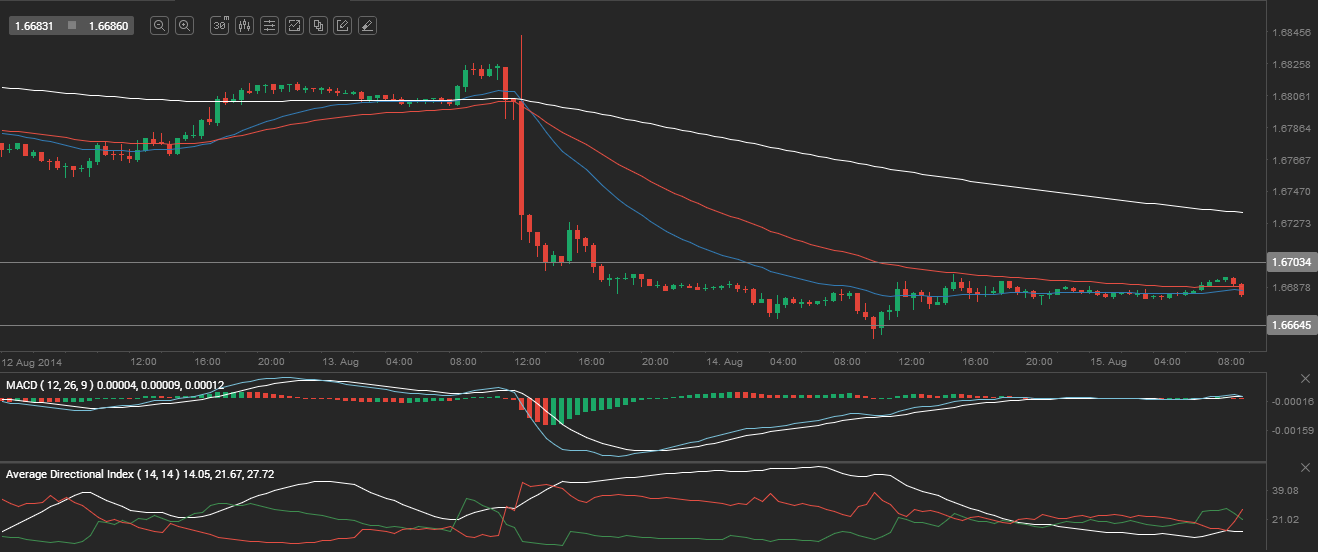
Yesterday’s trade saw GBP/USD within the range of 1.6658-1.6697. The pair closed at 1.6686, losing 0.01% on a daily basis.
At 6:46 GMT today GBP/USD was down 0.01% for the day to trade at 1.6684. The pair touched a daily low at 1.6682 at 2:10 GMT.
Fundamental view
United Kingdom
The second estimate of United Kingdoms GDP probably confirmed the preliminary estimate, released on July 25th, that economy expanded at a rate of 3.1% during the second quarter of the year compared to the same period a year ago. If so, this would be the highest rate of economic growth since the last quarter of 2007. UK economy expanded at an annualized rate of 3.0% in the first quarter of the current year and has also been growing persistently since Q4 2012.
Within the period of Q2 2013 and Q2 2014 construction in the United Kingdom have expanded 4.2%, marking a fifth successive period of gains. Output in key sectors such as business services and finance rose 4.2%, industrial activity expanded 2.2%, while transport, storage and communication added 2.2 %.
On a quarterly basis, the second estimate of UK GDP probably also matched the first estimate of a 0.8% growth during Q2.
The GDP represents the total monetary value of all goods and services produced by one nation over a specific period of time. What is more, it is the widest indicator of economic activity in the country. The report on GDP is of huge importance for traders, operating in the Foreign Exchange Market, because it serves as evidence of growth in a productive economy, or as evidence of contraction in an unproductive one. As a result, currency traders will look for higher rates of growth as a sign that interest rates will follow the same direction. Higher interest rates will usually attract more investors, willing to purchase assets in the UK, while, at the same time, this will increase demand for the pound. Therefore, in case growth rate exceeded market expectations, this would provide support to the local currency. The Office for National Statistics is expected to release the revised GDP estimate at 8:30 GMT.
United States
United States’ annualized index of producer prices (PPI) probably slowed down to 1.8% in July, according to the median estimate by experts, from 1.9% in June. This index reflects the change in prices of over 8 000 products, sold by manufacturers during the respective period. The PPI differs from the CPI, which measures the change in prices from consumer’s perspective, due to subsidies, taxes and distribution costs of different types of manufacturers in the country. In case producers are forced to pay more for goods and services, they are more likely to pass these higher costs to the end consumer. Therefore, the PPI is considered as a leading indicator of consumer inflation. Lower than expected producer prices would have a bearish effect on the greenback.
Nation’s annualized core PPI, which excludes prices of volatile categories such as food and energy, probably also slipped to 1.6% in July from 1.8% in the prior month. This indicator is quite sensitive to changes in aggregate demand, thus, it can be used as a leading indicator for economy. However, because of its restrained scope, it is not suitable for future inflation forecasts. The Bureau of Labor Statistics is expected to publish the official PPI readings at 12:30 GMT.
The New York Empire State Manufacturing Index probably fell to a reading of 20.00 in August, according to the median estimate by experts, from 25.60 in the prior month. The index is based on the monthly Empire State Manufacturing Survey, which is conducted by the Federal Reserve Bank of New York. About 200 top manufacturing executives respond to a questionnaire, sent out during the first day of the month. They provide their estimates in regard to the performance of several business indicators from the prior month, while also forecasting performance during the upcoming six months.
The ”general business conditions” component of the index is based on a distinct question, posed on the Empire State Manufacturing Survey, thus, it is not a weighted average of the other indicators. These indicators, which are only applicable to the manufacturing facilities of survey respondents in the region of New York, include new orders, shipments, unfilled orders, delivery time, inventories, prices paid, prices received, number of employees including contract workers, average employee work week, technology spending and capital expenditures.
The general business conditions component and the sub-indexes for the 11 indicators are calculated by subtracting the percentage of respondents, rating an indicator as ”lower” (a drop), from the percentage of respondents, rating the same indicator as ”higher” (an increase). In case 33% of survey respondents stated that business conditions had improved during the current month, 50% stated that conditions had not changed, and 17% of the respondents stated that conditions had deteriorated, the index would have a reading of 16. Values above 0.00 are indicative of improving business conditions in the region. Higher than anticipated readings would certainly boost demand for the US dollar. The Federal Reserve Bank of New York is expected to release the official results from its survey at 12:30 GMT.
Industrial output in the United States probably expanded 0.3% in July compared to June, following another 0.2% gain in June compared to May. Annualized production rose 4.32% in June, marking a sixth consecutive period of gains.
The index of industrial production reflects the change in overall inflation-adjusted value of output in sectors such as manufacturing, mining and utilities in the United States. The index is sensitive to consumer demand and interest rates. As such, industrial production is an important tool for future GDP and economic performance forecasts. Those figures are also used to measure inflation by central banks as very high levels of industrial production may lead to uncontrolled levels of consumption and rapid inflation. It is a coincident indicator, which means that changes in its levels generally echo similar shifts in overall economic activity. Any increase in the index usually boosts demand for the US dollar.
The Board of Governors of the Federal Reserve is to release the production data at 13:15 GMT.
In addition, Capacity Utilization Rate in the country probably increased to 79.2% in July from 79.1% in June. This indicator represents the optimal rate for a stable production process, or the highest possible level of production in an enterprise, in case it operates within a realistic work schedule and has sufficient raw materials and inventories at its disposal. High rates of capacity utilization usually lead to inflationary pressure. In general, higher rates tend to be dollar positive.
Last but not least, the monthly survey by Thomson Reuters and the University of Michigan may show that consumer confidence in the United States improved in August. The preliminary reading of the corresponding index, which usually comes out two weeks ahead of the final data, probably rose to 82.2 during the current month from 81.8 in July. The survey encompasses about 500 respondents throughout the country. The index is comprised by two major components – a gauge of current conditions and a gauge of expectations. The current conditions index is based on the answers to two standard questions, while the index of expectations is based on three standard questions. All five questions have an equal weight in determining the value of the overall index. In case the gauge of consumer sentiment showed a larger improvement than projected, this would boost demand for the US dollar. The official reading is due out at 13:55 GMT.
Technical view
According to Binary Tribune’s daily analysis, the central pivot point for the pair is at 1.6680. In case GBP/USD manages to breach the first resistance level at 1.6703, it will probably continue up to test 1.6719. In case the second key resistance is broken, the pair will probably attempt to advance to 1.6742.
If GBP/USD manages to breach the first key support at 1.6664, it will probably continue to slide and test 1.6641. With this second key support broken, the movement to the downside will probably continue to 1.6625.
The mid-Pivot levels for today are as follows: M1 – 1.6633, M2 – 1.6653, M3 – 1.6672, M4 – 1.6692, M5 – 1.6711, M6 – 1.6731.
In weekly terms, the central pivot point is at 1.6809. The three key resistance levels are as follows: R1 – 1.6852, R2 – 1.6930, R3 – 1.6973. The three key support levels are: S1 – 1.6731, S2 – 1.6688, S3 – 1.6610.