During Friday’s trading session CAD/MXN traded within the range of 12.047-12.190 and closed at 12.071, losing 0.66% for the day and 0.04% on a weekly basis.
At 8:12 GMT today CAD/MXN was losing 0.03% for the day to trade at 12.069. The pair touched a daily low at 12.050 at 5:00 GMT.
Fundamental view
Canada
Annualized number of housing starts in Canada probably declined to 195 300 in July from 198 200 in the previous month. Housing starts are considered as a key indicator, reflecting nation’s housing sector’ resilience. In case the number of housing starts rose more than expected, this would provide support to the loonie. Canada’s Mortgage and Housing Corporation will release the official data at 12:15 GMT.
Mexico
Mexico’s annualized industrial production probably expanded 0.69% in June, according to the median forecast by experts, following another 1.6% increase in May. In monthly terms, nation’s industrial production probably rose 0.32% last month. The index reflects the change in overall inflation-adjusted value of output in sectors such as manufacturing, mining and utilities. In case output expanded more than anticipated, this would have a bullish effect on the peso.
Insituto Nacional de Estadistica Y Geografia is expected to release the official report at 13:00 GMT.
Technical view
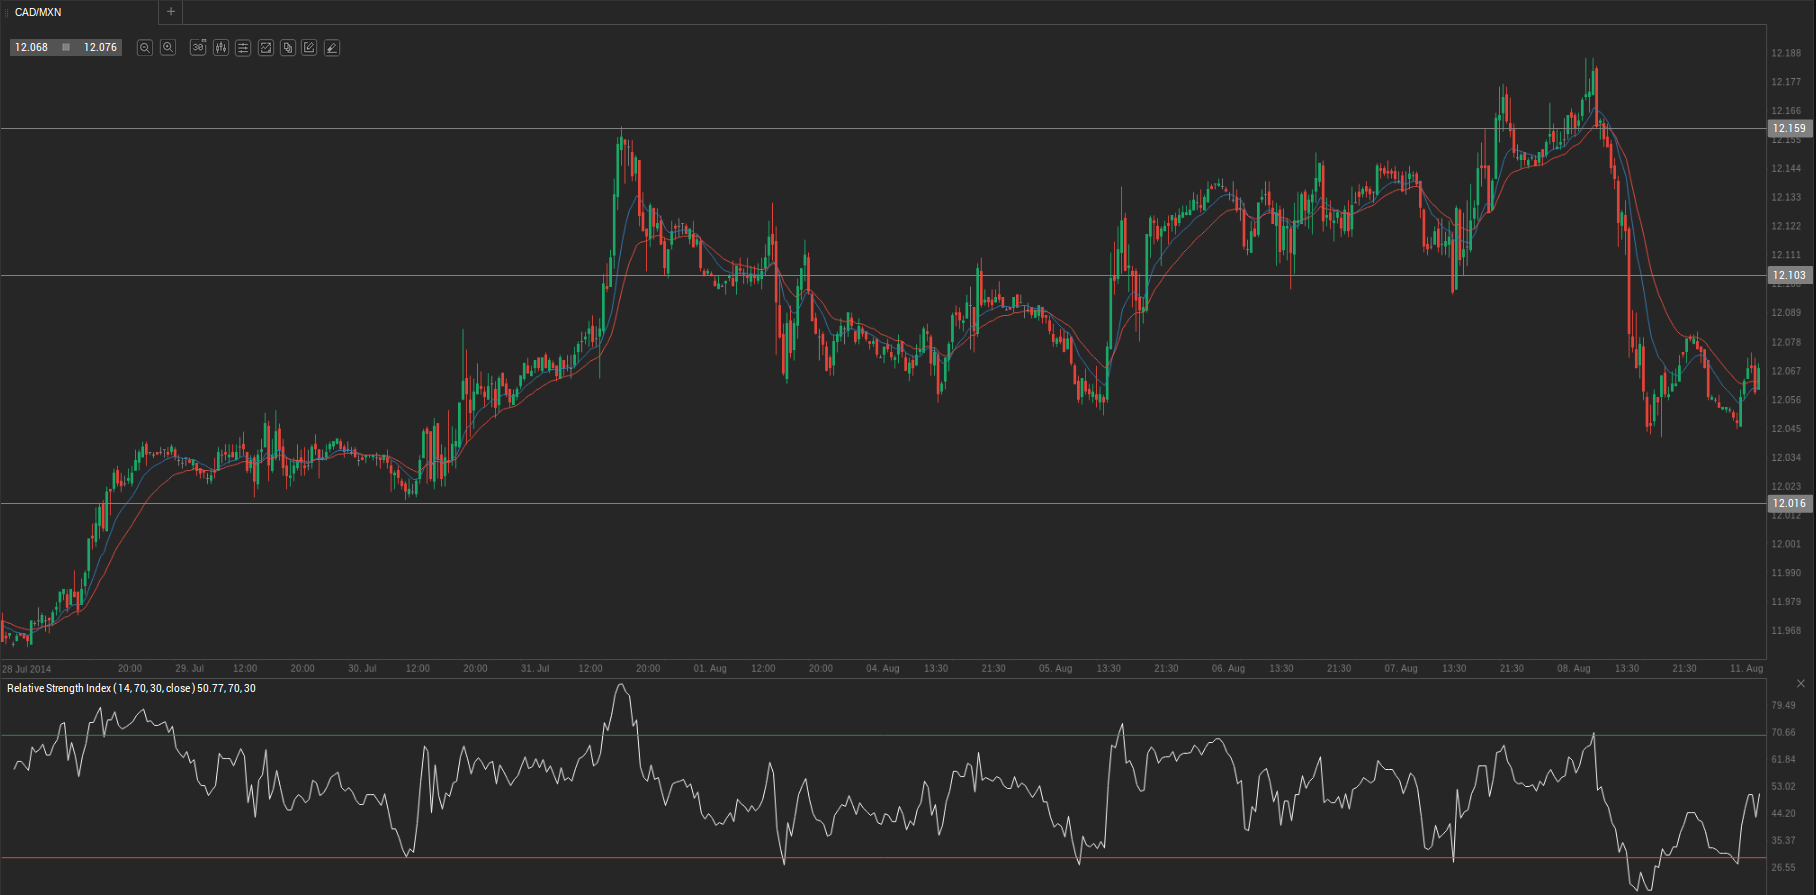
According to Binary Tribune’s daily analysis, the central pivot point for the pair is at 12.103. In case CAD/MXN manages to breach the first resistance level at 12.159, it will probably continue up to test 12.245. In case the second key resistance is broken, the pair will probably attempt to advance to 12.301.
If CAD/MXN manages to breach the first key support at 12.016, it will probably continue to slide and test 11.960. With this second key support broken, the movement to the downside will probably continue to 11.873.
In weekly terms, the central pivot point is at 12.103, matching the daily pivot point. The three key resistance levels are as follows: R1 – 12.158, R2 – 12.245, R3 – 12.301. The three key support levels are: S1 – 12.016, S2 – 11.960, S3 – 11.873.