During yesterday’s trading session USD/MXN traded within the range of 12.9547-12.9835 and closed at 12.9740.
At 8:14 GMT today USD/MXN was adding 0.05% for the day to trade at 12.9774. The pair touched a daily high at 12.9798 at 8:00 GMT.
Fundamental view
United States
The cost of living in the US probably jumped 2.1% in June compared to the same month a year ago, according to the median analyst’ estimate. The Consumer Price Index (CPI) measures the change in prices of a range of products in different categories of consumer spending, such as food, clothing, rent and medical care and etc. It excludes investment costs, such as purchases of stocks and bonds, real estate and business expenses. Life insurance is also excluded from the scheme, although health insurance, property tax and motor vehicles are present in the study. Purchases of homes, antiques and collectibles are also treated as investment costs and are therefore excluded from the study. In the compilation of the index, the urban area of the United States is divided into 38 geographic areas called index areas, all goods and services purchased by the population are divided into 211 categories. It is expressed as a percentage change from the corresponding month a year earlier.
The core CPI probably rose 2.0% in June from a year ago, according to the median forecast by experts. The core CPI, excludes prices for food and energy, because they are the two most volatile components in the CPI. For this reason, many analysts prefer to use core inflation for their objectives. Expressed as a percentage change from the corresponding month a year earlier. The US Bureau of Labor Statistics is scheduled to release its report at 12:30 GMT in Washington. Higher-than-expected readings will certainly heighten greenback’s appeal.
In addition, at 14:00 GMT the National Association of Realtors (NAR) will report on existing home sales in the United States during June. The existing home sales probably rose 1.7% to an annualized pace of 4.99 million units in June from a month ago. In May compared to April, existing home sales jumped by 4.9% (the most since July 2013) to an annualized level of 4.89 million. The sample of data encompasses condos, co-ops and single-family houses.
Statistical data on existing home sales is often used along with statistical figures regarding the New home sales and Pending home sales, with the major objective being to draw a conclusion how nation’s housing sector is performing, regardless of interest rates. The most active house-purchasing period in the United States is usually between the months of March through June. Therefore, in case statistical data revealed a sudden drop in the number of homes sold rather than an improvement during this period, this would be considered as a signal of weakness in country’s housing market.
The report on existing home sales usually does not cause a real direct impact on US economy. Actually, this effect appears to be minimal, due to the fact that nothing is produced with the mere sale of an existing home. In terms of economic activity, the sale of an existing house may be related only to interior design and purchases of new furniture.
In case the index increased more than anticipated, this would support the greenback.
Mexico
The annualized retail sales in Mexico probably advanced 1.1% in May from a year ago. In April, the index declined 0.4%. Annualized retail sales in the country averaged 2.01% from 2002 until 2014, marking an all-time high of 8.7% in November 2004 and a record-low of -6.5% in February 2009.
The index reflects the year-over-year change in retail sales by comparing the aggregated sales of retail goods and services during a certain month to the same month a year ago.
The Mexican Instituto Nacional de Estadística y Geografía (INEGI) will release an official report at 13:00 GMT. In case retail sales jumped more than expected, this would boost pesos demand.
Technical view
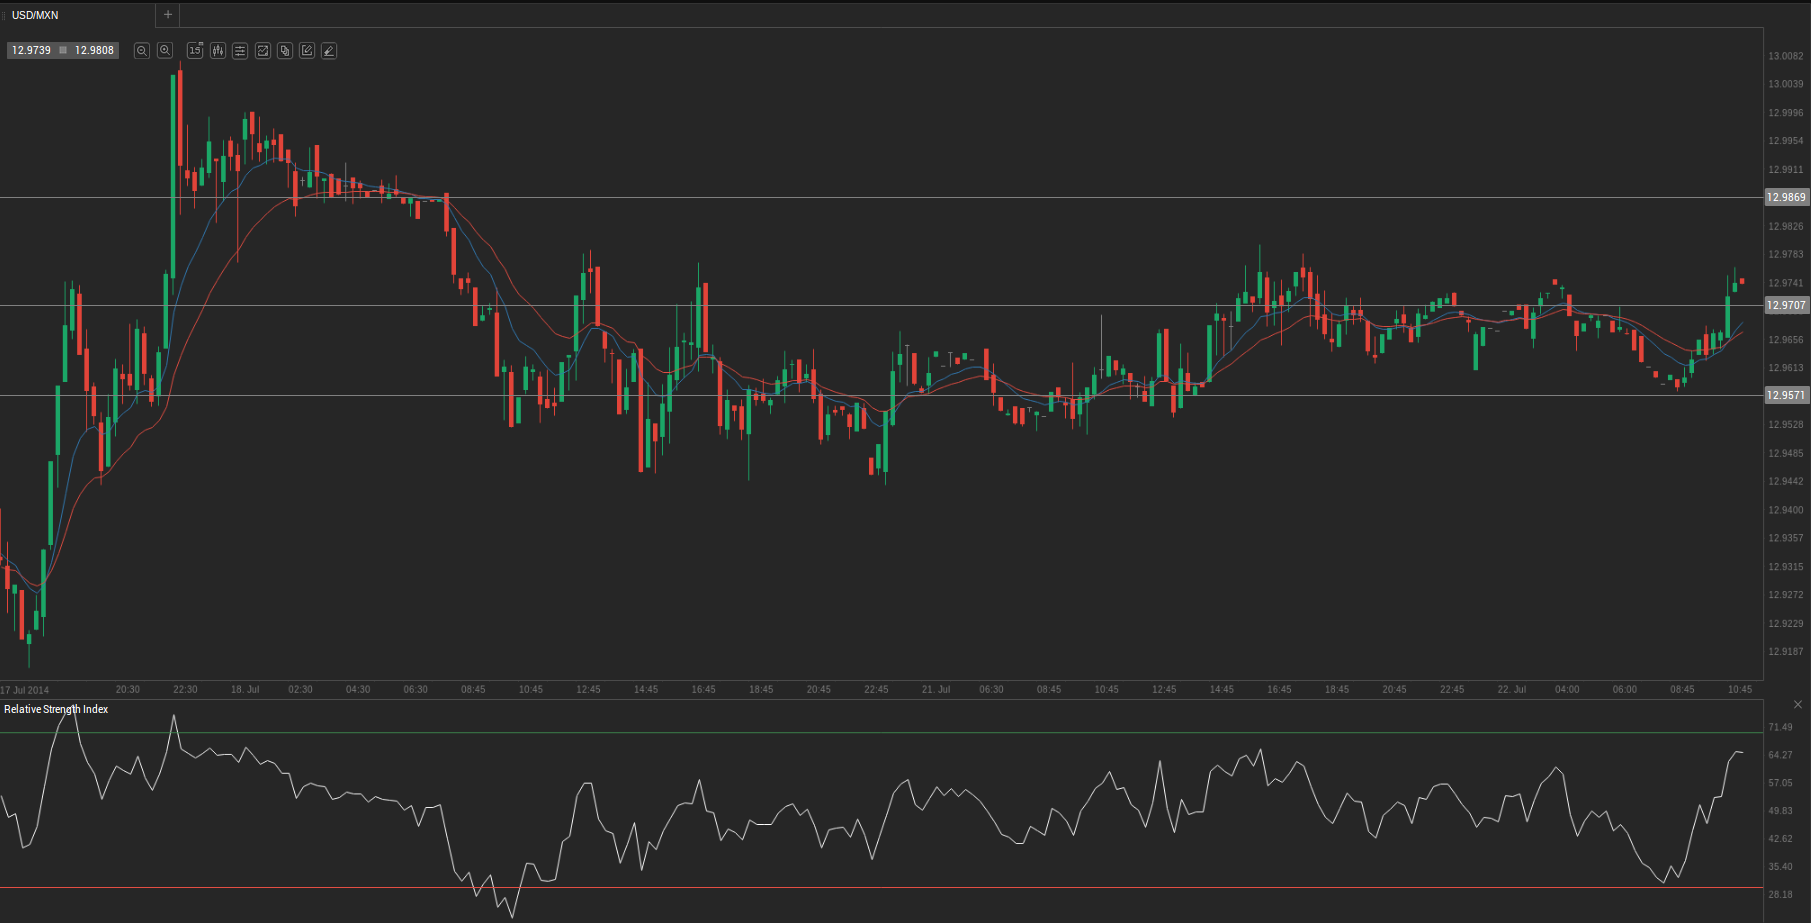
According to Binary Tribune’s daily analysis, the central pivot point for the pair is at 12.9707. In case USD/MXN manages to breach the first resistance level at 12.9869, it will probably continue up to test 12.9995. In case the second key resistance is broken, the pair will probably attempt to advance to 13.0156.
If USD/MXN manages to breach the first key support at 12.9571, it will probably continue to slide and test 12.9419. With this second key support broken, the movement to the downside will probably continue to 12.9292.