Join our community of traders FOR FREE!

  • Learn
  • Improve yourself
  • Get Rewards
Learn More

During Friday’s trading session EUR/MXN traded within the range of 17.495-17.646 and closed at 17.641.

At 7:02 GMT today EUR/MXN was adding 0.03% for the day to trade at 17.645. The pair touched a daily high at 17.645 at 7:01 GMT.

Fundamental view

Euro zone

Confidence among investors in the Euro zone probably improved during the current month, with the corresponding index coming in at a reading of 13.2. In May it stood at 12.8. The index is based on results from the SENTIX survey, one of the most prominent surveys, reflecting investors’ opinion in Germany. It encompasses 2 400 respondents, with 510 of them being institutional investors. Respondents present their expectations regarding ten different markets for a period of one and six months. The value of the index is evaluated, as the number of investors projecting a surge in a given market is subtracted from the number of those projecting a drop and the resulting difference is divided by the total number of respondents. Higher than expected readings would be supportive for the euro.

The official result is expected at 8:30 GMT.

Mexico

The annualized index of consumer prices (CPI) in Mexico probably slowed down to 3.47% in May, according to the median forecast by experts, from 3.5% in April. The index measures the change in price levels of a basket of goods and services from consumer’s perspective and also reflects purchasing trends. In case the CPI rose more than projected, this would have a bullish effect on Mexican peso.

Insituto Nacional de Estadistica Y Geografia is expected to release the official report at 13:00 GMT.

Technical view
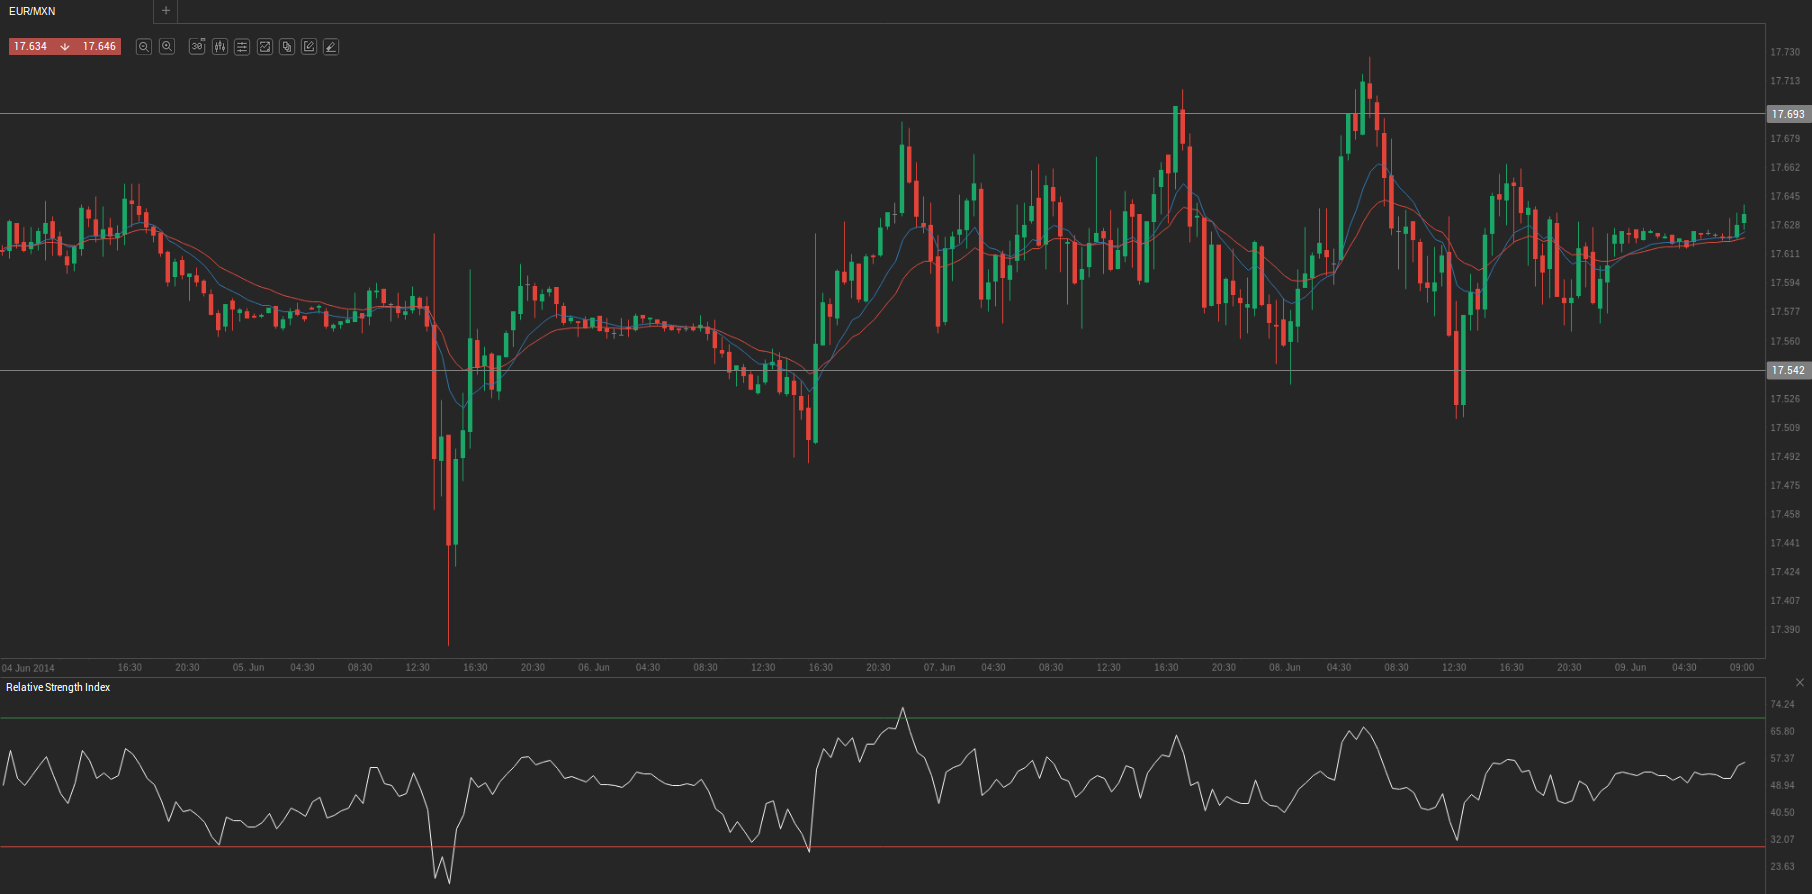
Screenshot from 2014-06-09 10:08:11

According to Binary Tribune’s daily analysis, in case EUR/MXN manages to breach the first resistance level at 17.693, it will probably continue up to test 17.745. In case the second key resistance is broken, the pair will probably attempt to advance to 17.844.

If EUR/MXN manages to breach the first key support at 17.542, it will probably continue to slide and test 17.443. With this second key support broken, the movement to the downside will probably continue to 17.391.

TradingPedia.com is a financial media specialized in providing daily news and education covering Forex, equities and commodities. Our academies for traders cover Forex, Price Action and Social Trading.

Related News

  • Pound-Yen Hits Multi-Week Low as BoJ Repricing Boosts JPYPound-Yen Hits Multi-Week Low as BoJ Repricing Boosts JPY Key Moments GBP/JPY fell for a second consecutive session, sliding to around 212.75-212.70, its lowest level in roughly three and a half weeks. Hawkish repricing of Bank of Japan policy and speculation about official rate […]
  • Finland Halts Google Data Center Work for Eco ReviewFinland Halts Google Data Center Work for Eco Review Key Moments Finnish authorities ordered preparatory work at Google's planned Muhos and Kajaani data center sites to be suspended until mandatory environmental impact assessments are completed. The move affects part of […]
  • Commodity Market: Support and Resistance Levels for Thursday (October 20th 2016)Commodity Market: Support and Resistance Levels for Thursday (October 20th 2016) Silver (SI) for December delivery (1 Troy Ounce)R1 – $17.683 R2 – $17.703 R3 (Range Resistance – Sell) – $17.724 R4 (Long Breakout) – $17.784 R5 (Breakout Target 1) – $17.855 R6 (Breakout Target 2) – $17.884S1 – $17.643 S2 – […]
  • Australian Dollar Slides, Oil Jumps on Mideast TensionsAustralian Dollar Slides, Oil Jumps on Mideast Tensions Key Moments AUD/USD trades about 0.65% lower near 0.6985 in the Asian session as risk aversion intensifies. WTI crude jumps more than 25% above $110.00 after reported US-Israeli strikes on Iranian oil depots. Meanwhile, […]
  • Copper Holds Near Key Fibonacci Floor as Traders AssessCopper Holds Near Key Fibonacci Floor as Traders Assess Key Moments Copper recently closed at $6.521 on the 5-hour chart, sitting just above key Fibonacci support at $6.507. Price is trading below the 20-period moving average at $6.622 and the Ichimoku Tenkan line at $6.628, while […]
  • Forex Market: USD/BRL daily trading outlookForex Market: USD/BRL daily trading outlook Monday’s trade saw USD/BRL within the range of 2.2474 and 2.2295 the lowest since July 29th. The pair closed at 2.2458, adding 0.41% on a daily basis.At 9:34 GMT today USD/BRL was down 0.01% for the day to trade at 2.2462, having shifted […]