Join our community of traders FOR FREE!

  • Learn
  • Improve yourself
  • Get Rewards
Learn More

During yesterday’s trading session USD/MXN traded within the range of 12.9046-12.9584 and closed at 12.9092.

At 11:09 GMT today USD/MXN was gaining 0.15% for the day to trade at 12.9253. The pair touched a daily high at 12.9331 at 10:30 GMT.

Fundamental view

United States’ annualized index of producer prices (PPI) probably jumped by 1.7% in April, according to the median estimate by experts, after adding 1.4% in the previous month. This index reflects the change in prices of over 8 000 products, sold by manufacturers during the respective period. The PPI differs from the CPI, which measures the change in prices from consumer’s perspective, due to subsidies, taxes and distribution costs of different types of manufacturers in the country. In case producers are forced to pay more for goods and services, they are more likely to pass these higher costs to the end consumer. Therefore, the PPI is considered as a leading indicator of consumer inflation. Higher than expected producer prices would have a bullish effect on the greenback.

Nation’s annualized core PPI, which excludes prices of volatile categories such as food and energy, probably remained steady at 1.4% in April. This indicator is quite sensitive to changes in aggregate demand, thus, it can be used as a leading indicator for the economy. However, because of its restrained scope, it is not suitable for future inflation forecasts.

The US Bureau of Labor Statistics is expected to publish the official PPI readings at 12:30 GMT. Higher-than-expected readings would support greenback’s demand.

Technical view

Screenshot from 2014-05-14 14:13:57

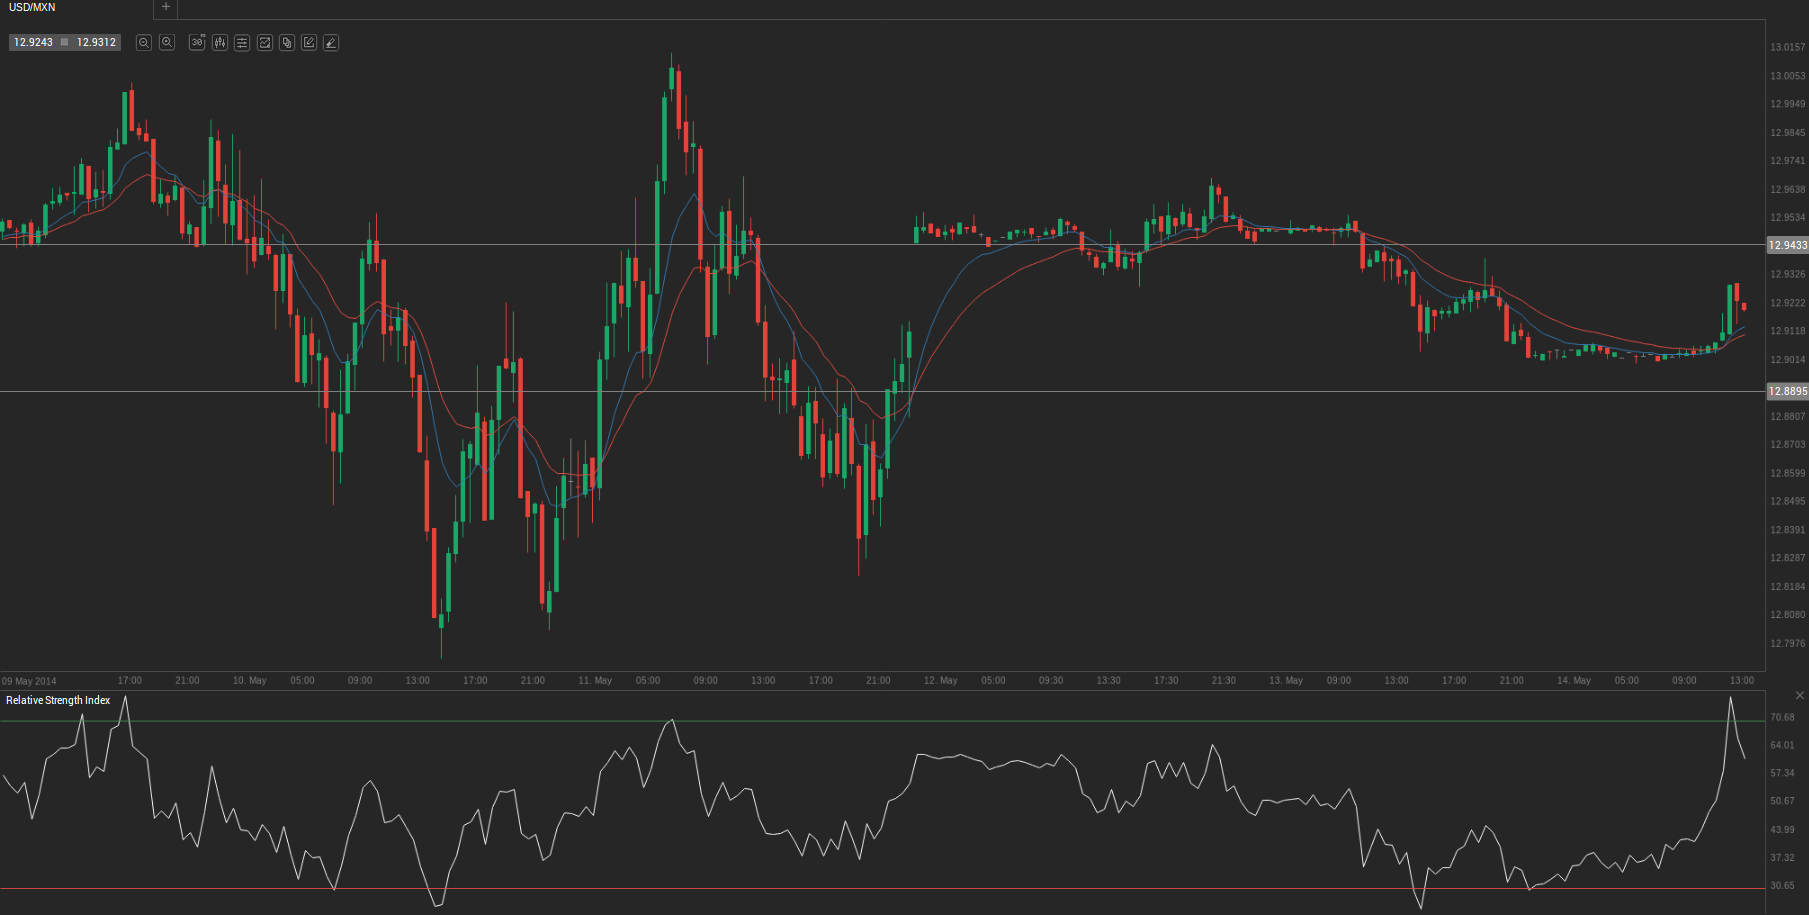
According to Binary Tribune’s daily analysis, in case USD/MXN manages to breach the first resistance level at 12.9433, it will probably continue up to test 12.9779. In case the second key resistance is broken, the pair will probably attempt to advance to 12.9973.

If USD/MXN manages to breach the first key support at 12.8895, it will probably continue to slide and test 12.8703. With this second key support broken, the movement to the downside will probably continue to 12.8359.

TradingPedia.com is a financial media specialized in providing daily news and education covering Forex, equities and commodities. Our academies for traders cover Forex, Price Action and Social Trading.

Related News

  • Syntec Optics announces order for opto-mechanical sub-systemsSyntec Optics announces order for opto-mechanical sub-systems Syntec Optics (NASDAQ: OPTX), a supplier of scientific and technical instruments and defense and aerospace optics, said this week it had secured $2.8 million order for high-precision opto-mechanical components and sub-systems used in the […]
  • Microsoft share price up, agrees to end contract dispute with SamsungMicrosoft share price up, agrees to end contract dispute with Samsung Microsoft Corp and Samsung Electronic Co announced on Monday they have agreed to settle a contract dispute over the South Korean giants use of the Android operating system.Although Google owns the Android platform, some technologies used […]
  • Kiwi Slides as Geopolitical Tensions Propel US Dollar HigherKiwi Slides as Geopolitical Tensions Propel US Dollar Higher Key Moments NZD/USD trades near 0.5820 and is down 0.58% on the day, marking a fourth straight daily decline. Rising Oil prices tied to the Middle East conflict support the US Dollar and revive global inflation concerns. […]
  • Forex Market: GBP/CHF daily forecastForex Market: GBP/CHF daily forecast During yesterday’s trading session GBP/CHF traded within the range of 1.5330-1.5401 and closed at 1.5394.At 6:07 GMT today GBP/CHF was gaining 0.02% for the day to trade at 1.5401. The pair touched a daily high at 1.5408 at 2:50 […]
  • Forex Market: NZD/USD daily forecastForex Market: NZD/USD daily forecast During yesterday’s trading session NZD/USD traded within the range of 0.8678-0.8720 and closed at 0.8678.At 8:52 GMT today NZD/USD was losing 0.22% for the day to trade at 0.8671. The pair touched a daily low at 0.8663 at 7:50 GMT, […]
  • Forex Market: GBP/BGN trading outlook for March 28thForex Market: GBP/BGN trading outlook for March 28th Friday’s trade saw GBP/BGN within the range of 2.4689-2.4805. The pair closed at 2.4779, inching up 0.02% on a daily basis. It has been the 11th gain in the past 21 trading days and also a second consecutive one. In weekly terms, GBP/BGN lost […]