As of August 2025, the U.S. unemployment rate rose to 4.3%, the highest level since October 2021, a time of COVID-19-related shutdowns and mass layoffs. While far below the pandemic peak of nearly 15% in April 2020, the uptick this summer signals fresh strain in an economy that had appeared stable just months earlier. Long-term unemployment is stubbornly high, regional disparities are widening, and industries tied to consumer spending and manufacturing are softening. By contrast, fields like technology, healthcare, and logistics are still hiring.
The rise in unemployment has complicated the Federal Reserve’s balancing act. With rates still elevated (in the 4.00%-4.25% range) to curb inflation, policymakers face pressure to ease borrowing costs without reigniting price spikes. Against this backdrop, political tensions flared when President Trump dismissed the head of the Bureau of Labor Statistics after a weak jobs report, a move critics warned could undermine the independence of U.S. labor data and public confidence in the numbers themselves.
But what do the latest figures show? The team at TradingPedia decided to take a closer look at the latest U.S. Bureau of Labor Statistics unemployment data. We identified the states and metropolitan areas with the highest and lowest jobless rates and the parts of the country that have made significant progress or experienced notable rate changes between August 2024 and August 2025.
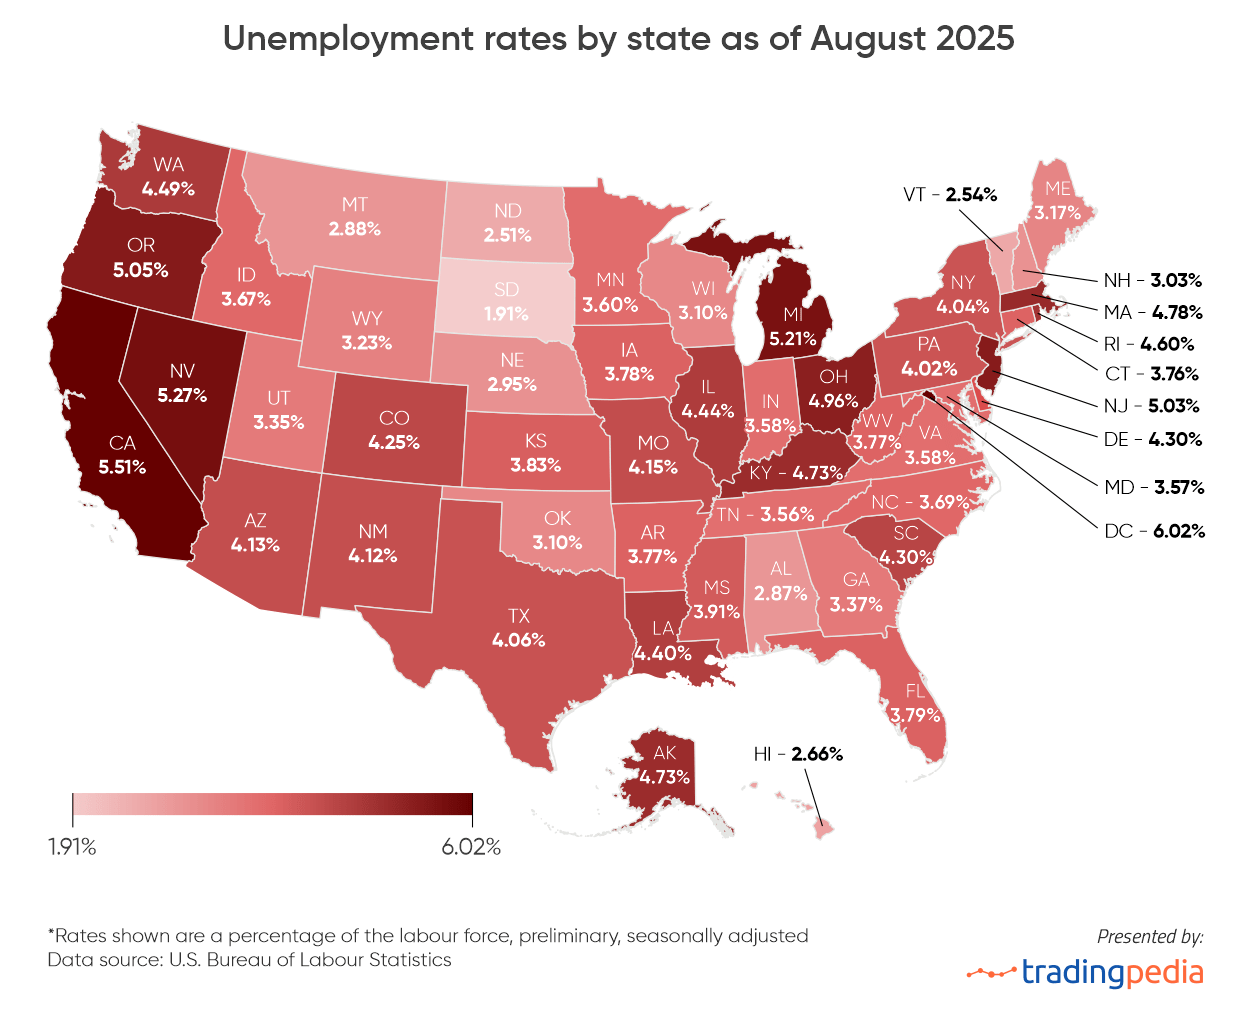
To better represent the data, we created a map illustrating the unemployed population as a percentage of the civilian labor force across every U.S. state.
The number of unemployed individuals in August 2025 totaled 7.3 million, up 7.63% from 7.1 million a year earlier. Job gains, although weaker than in earlier periods, remained positive in 2025 despite high interest rates and inflation. As of August 2025, the U.S. job market had experienced 54 consecutive months of job growth, making it the third-longest streak of employment expansion on record. However, by mid-2025 the pace of hiring had slowed considerably, with nonfarm payrolls rising by just 22,000 in August.
As of August 2025, the U.S. labor force participation rate, the proportion of the civilian noninstitutional population either employed or actively seeking employment, stood at 62.3%, up slightly from 62.2% in August 2024. The employment-population ratio, which measures the percentage of the working-age population currently employed, remained steady at 59.6%, unchanged from the previous month and at a modest decrease from 59.8% in August 2024. These figures indicate a labor market that is stable but exhibiting limited growth in workforce engagement year-over-year.
Job Growth by Industry Sector
Over the year, positive employment trends were observed in various industry sectors across the United States.
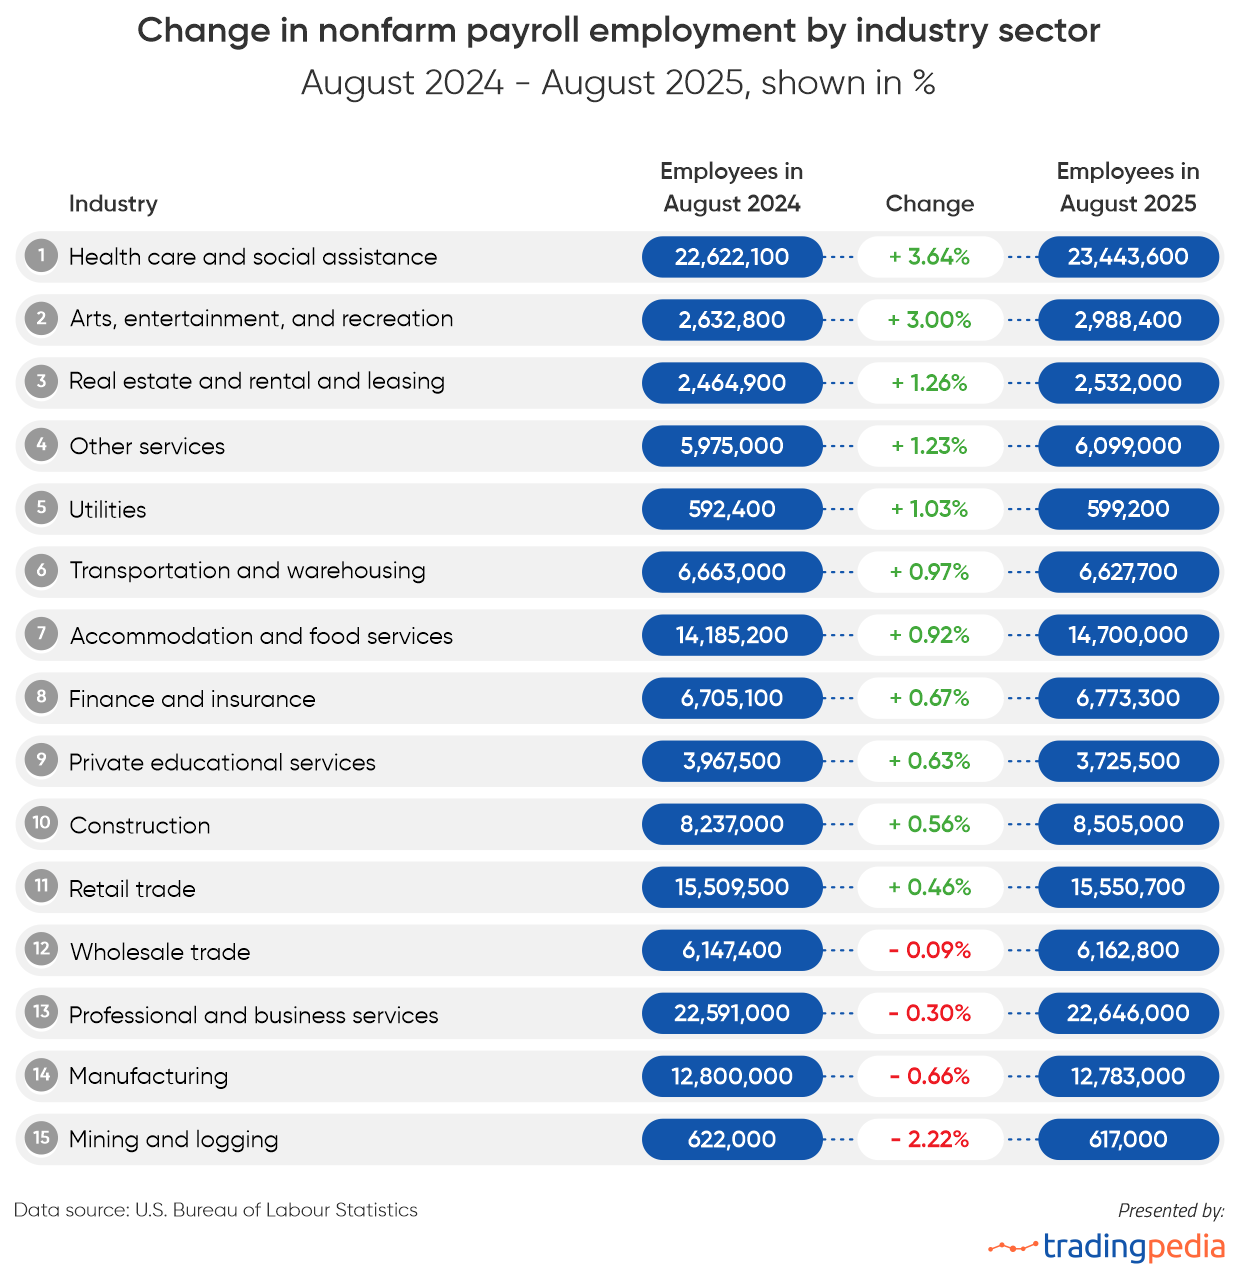
In August 2025, job growth was driven by industries such as private education and health services (+847,000 jobs) and leisure and hospitality (+221,000 jobs). The health care and social assistance sector has experienced the largest percentage rise in employment since August 2024 among the industries listed in our table, with a 3.64% increase. Meanwhile, mining and logging witnessed the largest year-over-year decrease at 2.22%.
Regarding job gains over the past twelve months on a state level, Texas led the pack with over 169,440 jobs added, followed by California with 163,433 and Tennessee with 61,426.
Fastest-Growing Wages by Industry
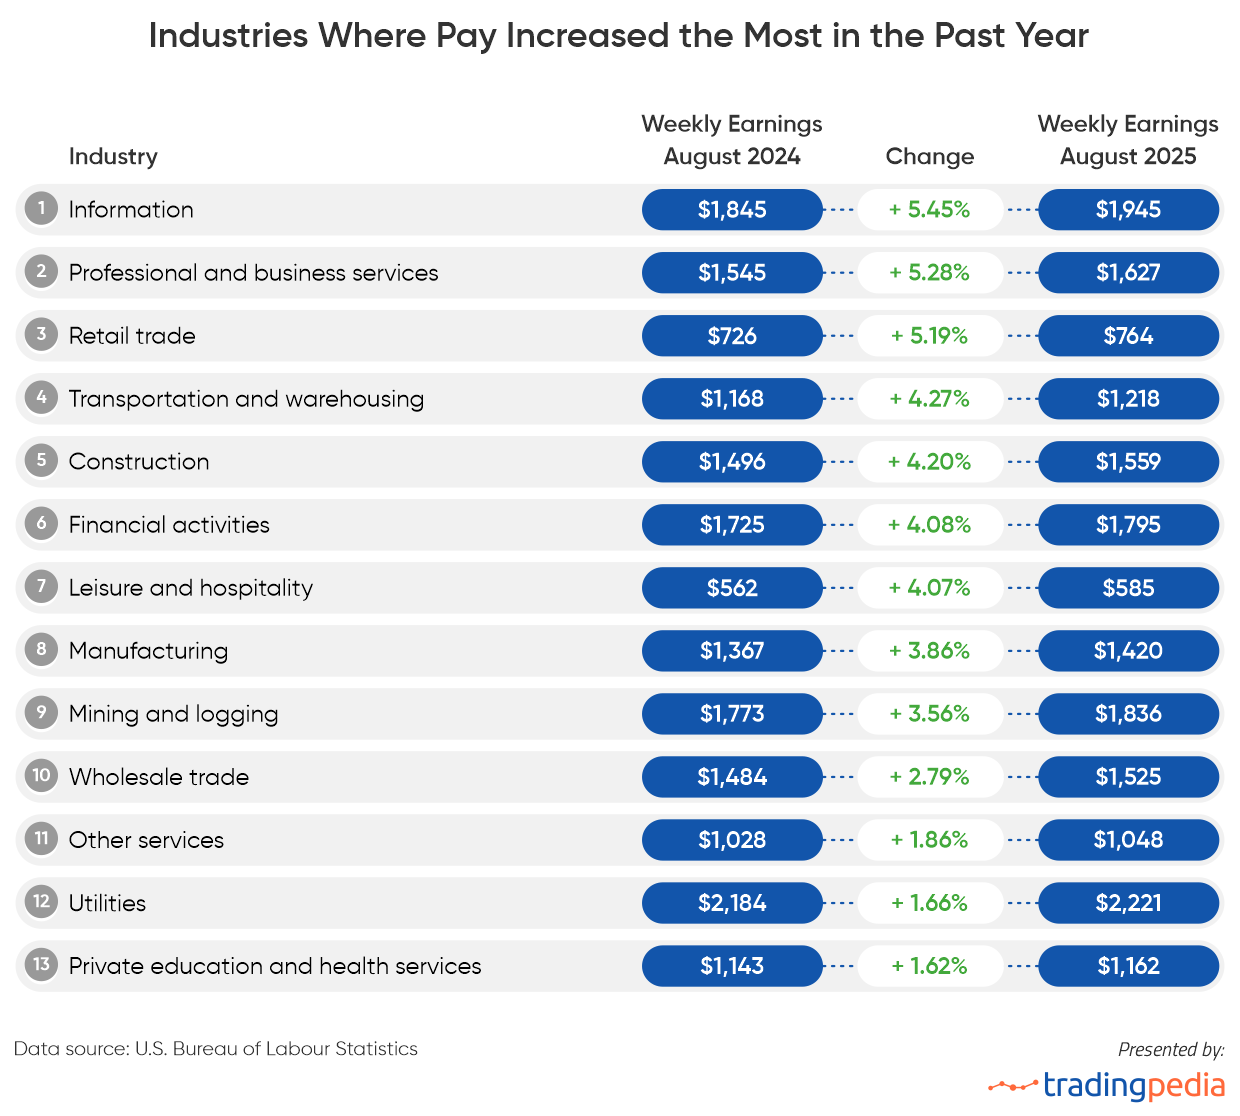
Over the past year, wage growth has accelerated in industries with the tightest labor markets. Information services led the surge, with weekly earnings rising 5.45% to $1,945, reflecting strong demand for tech talent. Professional and business services (+5.28%) and retail trade (+5.19%) also posted notable gains, showing that both skilled and frontline sectors are raising pay to retain workers amid turnover.
Pay also rose in essential and labor-constrained sectors, transportation and warehousing (+4.27%), construction (+4.20%), and financial activities (+4.08%), as well as in traditionally lower-paying industries like leisure and hospitality (+4.07%), reflecting broad wage pressure across the economy.
The data highlight a clear link between job growth and pay growth: industries rapidly adding workers are simultaneously offering higher wages, showing how a tight labor market is shaping U.S. earnings in mid-2025.
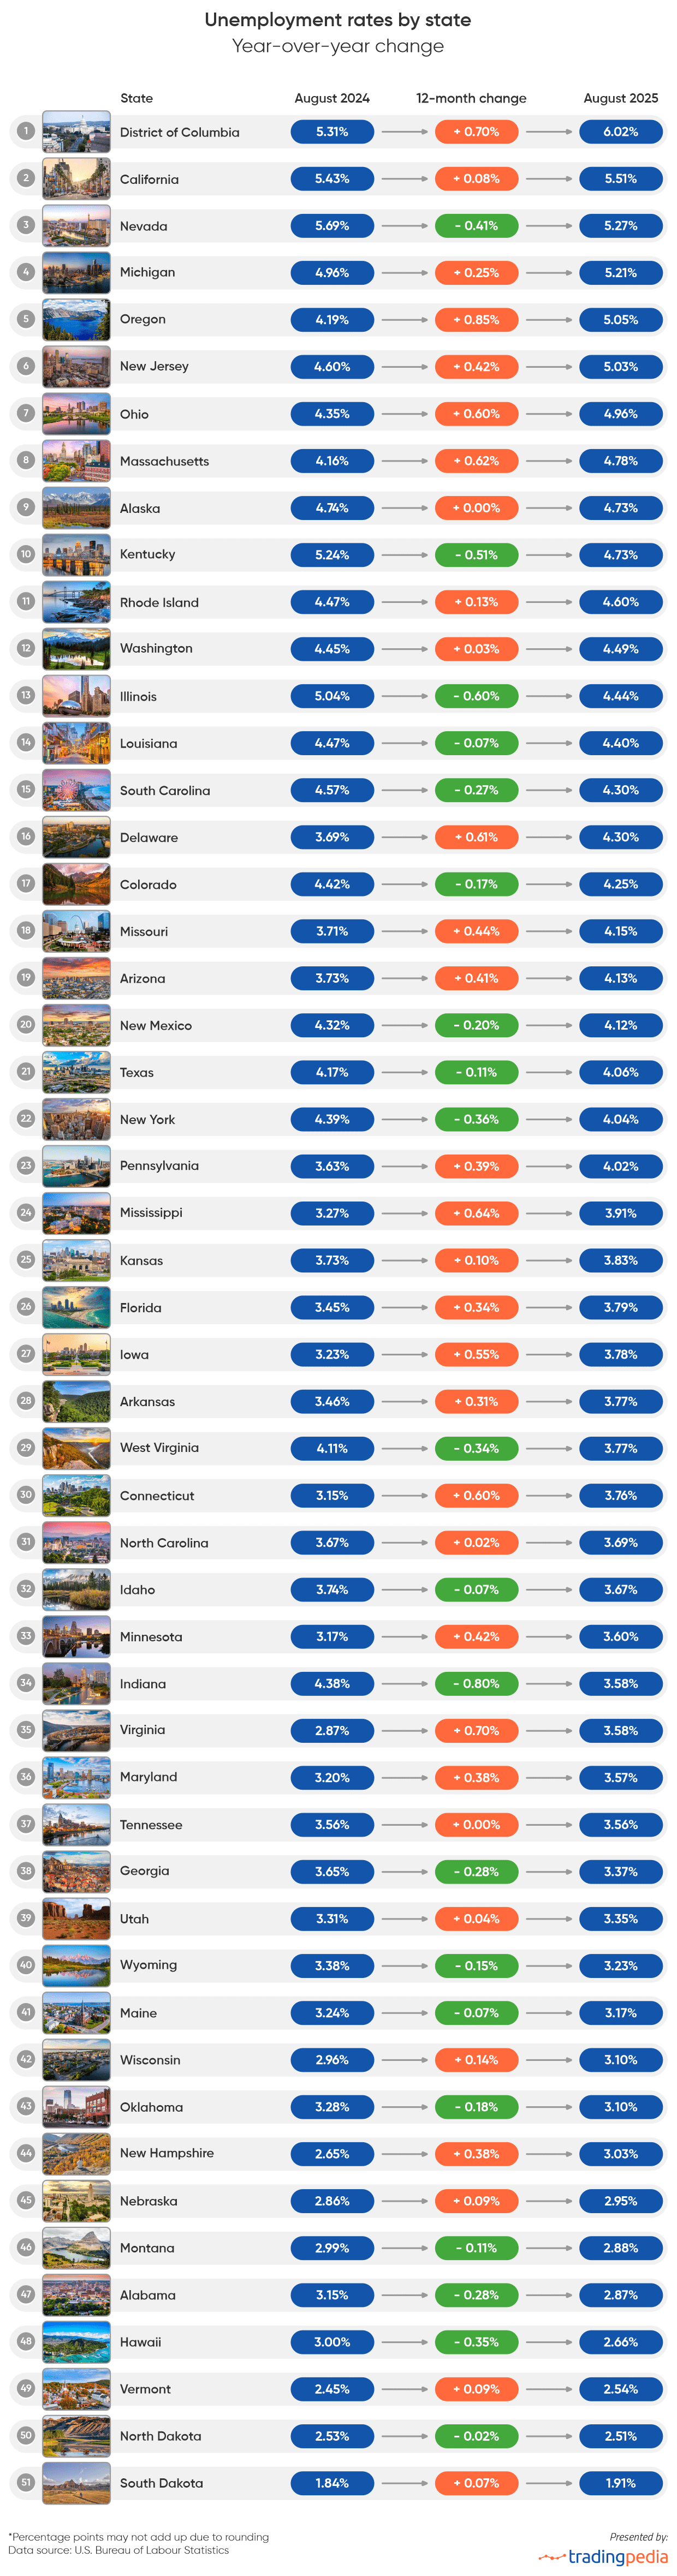
State Unemployment Rate Variations
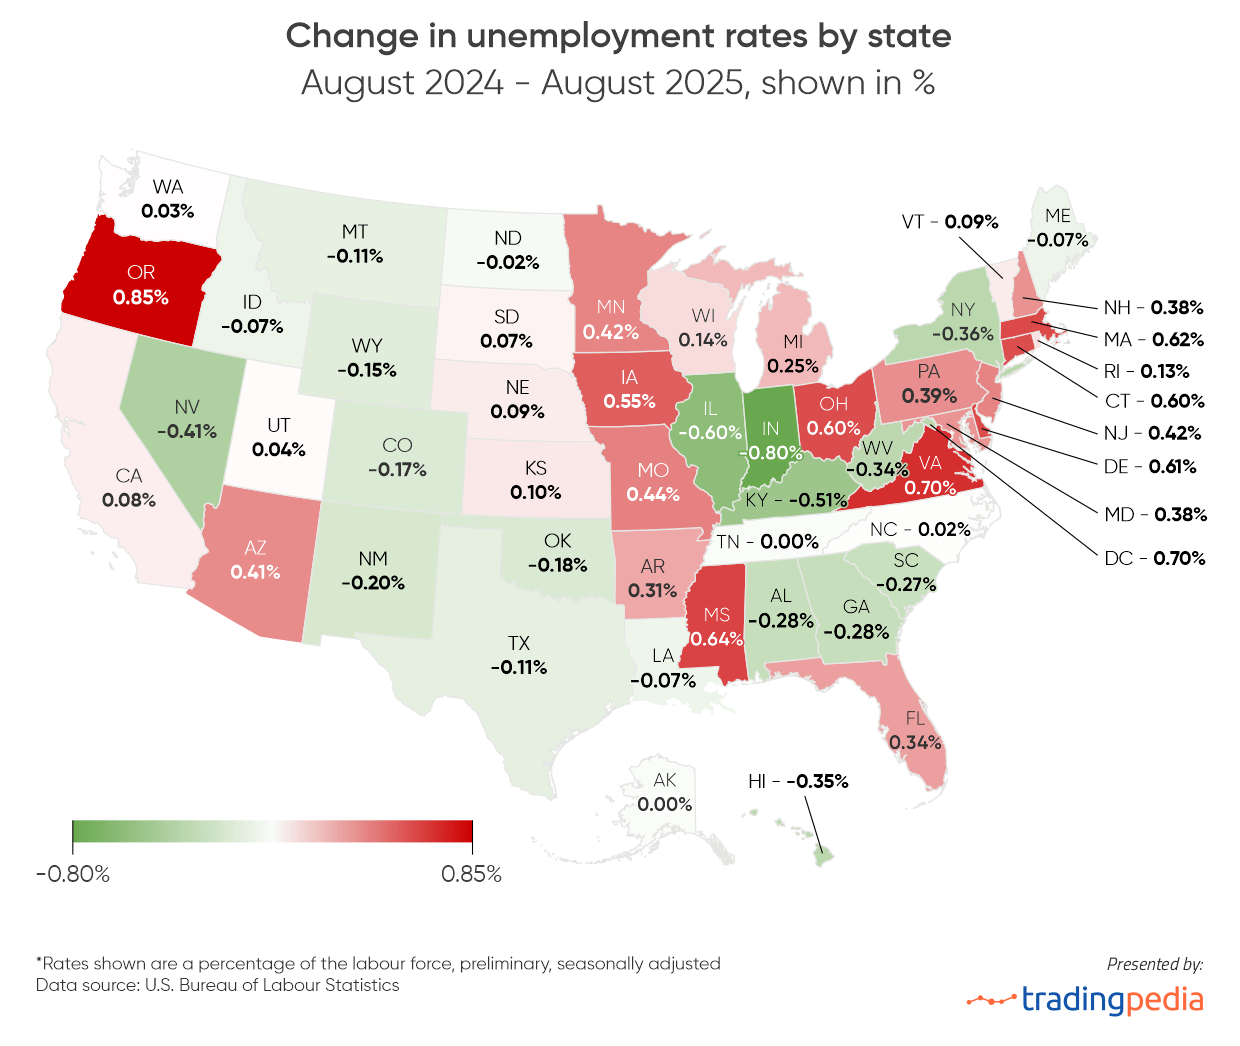
While the national unemployment rate is considered to be at a level that’s healthy for the economy (4.3% as of August 2025), there are significant state-by-state variations. The state unemployment rates indicate how different parts of the U.S. are affected by factors such as aggregate demand, global competition, education, automation, and demographics.
Over the past year, 28 states and the District of Columbia experienced increases in unemployment rates, while joblessness dropped in 20 states. Alaska and Tennessee stand out, with unemployment rates near 0%, among the lowest in the country.
Regional Differences in Employment Opportunities
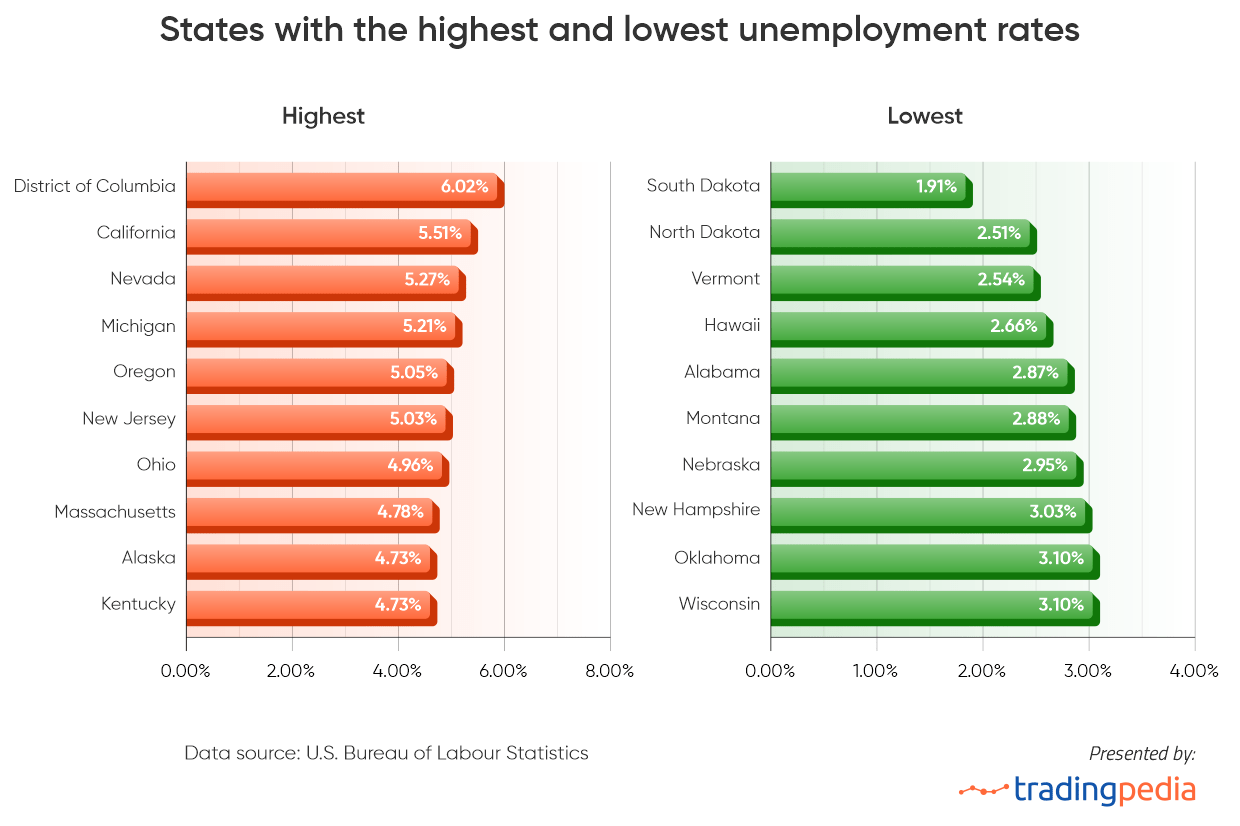
As of August 2025, unemployment rates in the United States vary widely, reflecting regional economic dynamics. The District of Columbia (6.02%), burdened by federal hiring freezes and mass layoffs, along with a large service sector, leads the nation in unemployment, followed by California (5.51%), where high living costs and tech sector volatility weigh on job growth, and Nevada (5.27%), still adjusting to shifts in tourism and hospitality demand.
At the other end, South Dakota (1.91%) and North Dakota (2.51%) boast the lowest unemployment rates, supported by strong agricultural output and energy production, while Vermont (2.54%) and Hawaii (2.66%) benefit from stable local economies and tourism resilience.
The remaining states fall along a gradient between roughly 3% and 4.5%, highlighting how local conditions, from population growth to dominant industries, create distinct regional labor market experiences.
Cities Leading the Nation in Unemployment
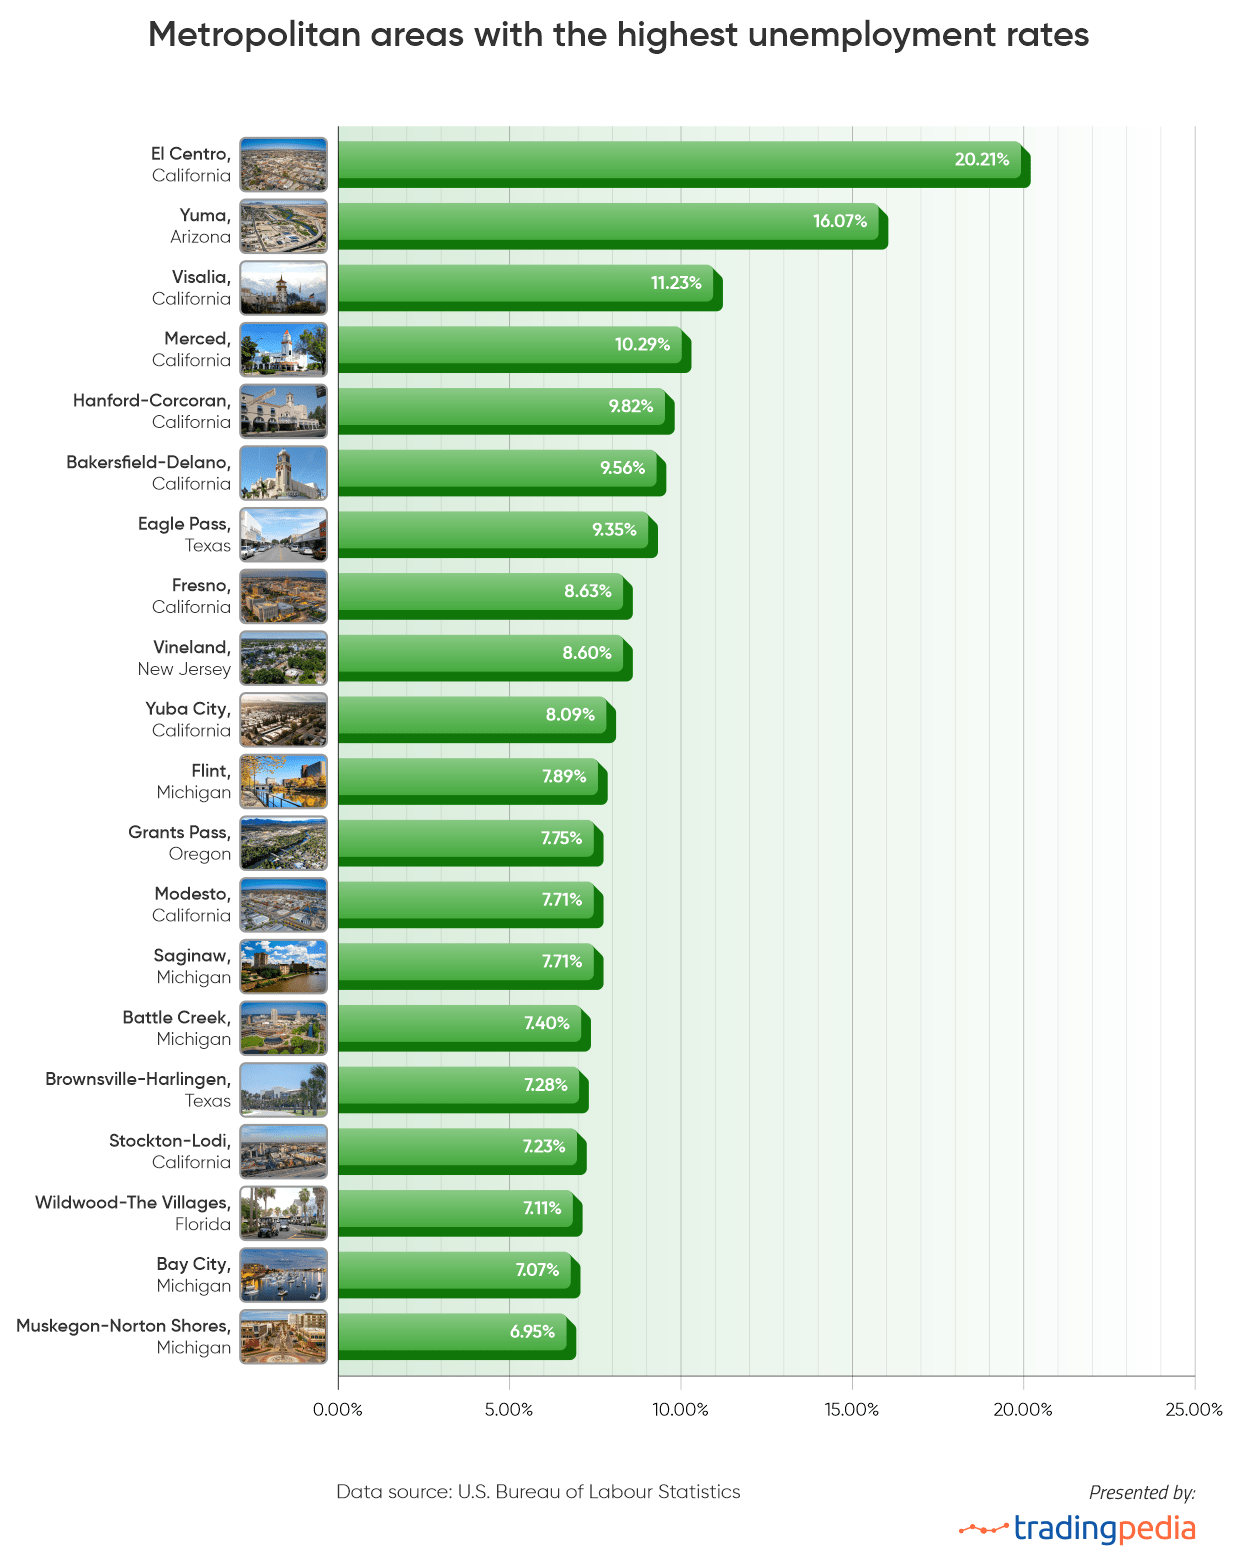
As of July 2025, certain U.S. metropolitan areas are experiencing alarmingly high unemployment rates, with El Centro, California, leading the nation at 20.21%, more than five times the national average. California dominates the list of cities with the highest joblessness rate, accounting for 9 out of the 20 top metros. Yuma, AZ, has the second-highest unemployment rate in the country, at 16.07%, followed by Visalia, CA, with 11.23%.
Rust Belt metros remain vulnerable: Flint (7.89%), Saginaw (7.71%), and Battle Creek (7.40%) in Michigan show that areas once reliant on manufacturing continue to grapple with structural unemployment. Even smaller metros like Vineland, New Jersey (8.60%) and Wildwood-The Villages, Florida (7.11%) highlight how seasonal economies and low-wage sectors contribute to elevated unemployment.
Overall, while the national labor market appears steady, these metropolitan hotspots reveal that joblessness remains highly localized, particularly in agricultural, border, and post-industrial regions.
Methodology
The civilian labor force encompasses all non-institutionalized civilians aged 16 and older, either employed or unemployed. The unemployment rate measures what percentage of the labor force is out of work. It is calculated by dividing the number of unemployed individuals in a state by its total labor force. A person who has not actively sought work for at least four weeks is no longer considered part of the labor force.
The rates shown in this report are seasonally adjusted (excluding the data on cities and employees by industry), which means that seasonal factors such as holiday periods and weather events, affecting employment, are removed. The main study period spans from August 2024 to August 2025.