
In 2023, an impressive 862.8 million passengers flew on 16.3 million domestic and international flights with U.S. airlines, according to the U.S. Department of Transportation. The cancellation rate for those was below 1.2%, the lowest rate in a decade. However, the team at Tradingpedia analyzed monthly on-time performance statistics from OAG and found that a staggering one-fifth of flights operated by American carriers had delays of more than 15 minutes in 2023. Moreover, last year, U.S. airports experienced departure delays of a little over 21% in all flights. Apart from being just a frustration and an inconvenience, flight delays cost businesses and passengers hundreds of millions of dollars.
So, how likely is your flight to be delayed or canceled? It depends on the carrier you fly with and the airport you depart from. We aggregated on-time performance data for the entire 2023 and identified the most punctual airlines and airports in the U.S. We also discovered those that are most likely to delay or cancel your flight.
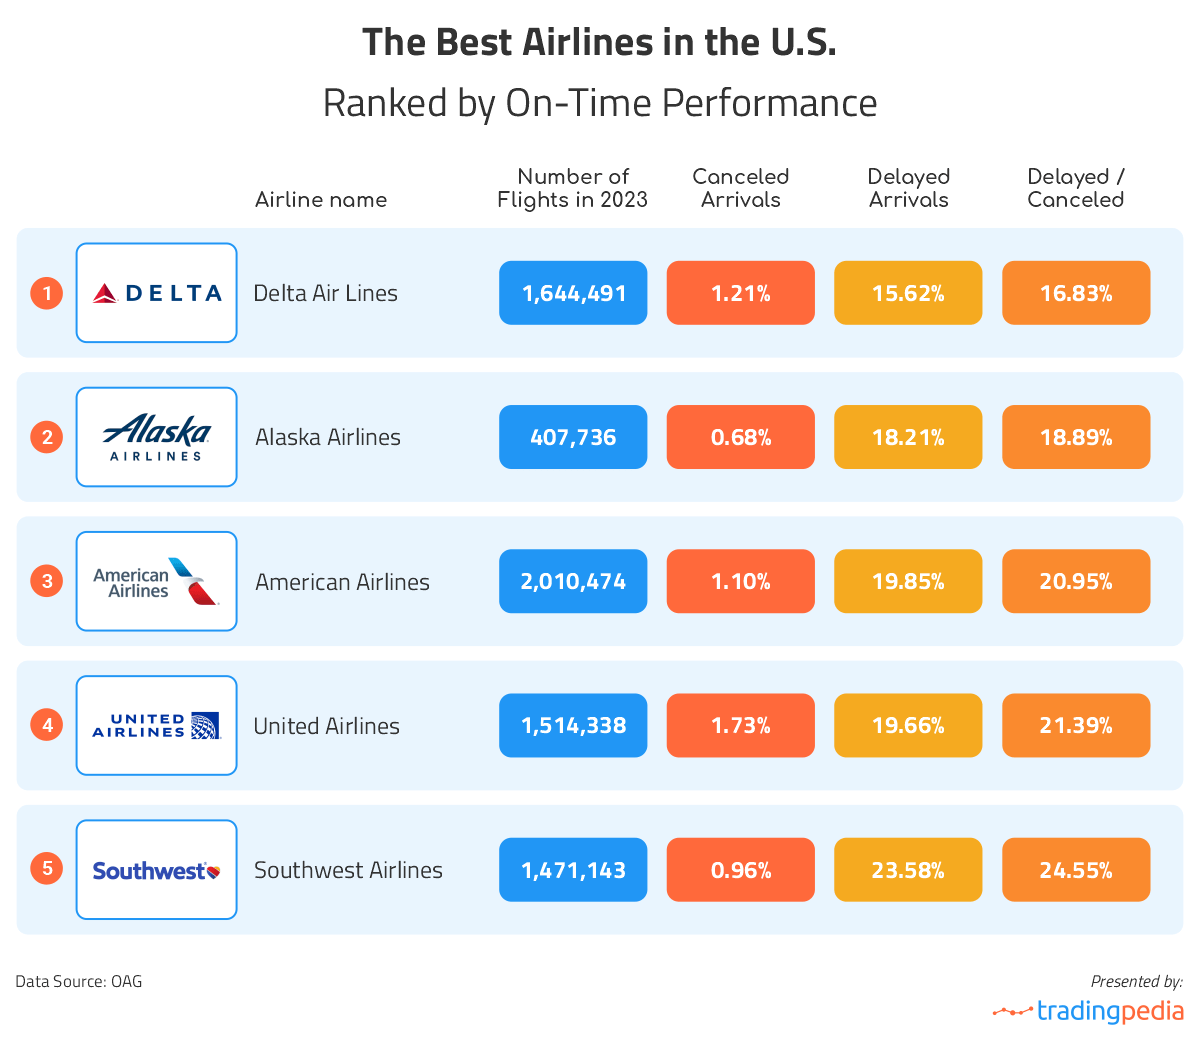
The best Airlines in the U.S. based on flight delays and cancellations?
We looked at airlines and airports with at least 20,000 flights last year and found that the airline least likely to delay your flight is Delta Air Lines, the oldest carrier in the U.S. and one of the largest airlines in the world. According to our calculations, Delta had the lowest percentage of delayed arrivals out of the 13 major airlines we analyzed. Only 15.6% of its flights did not arrive on time, which is better than the national average of 20.8%. The carrier completed 98.8% of all scheduled flights, having a cancellation rate of 1.2% for the entire 2023.
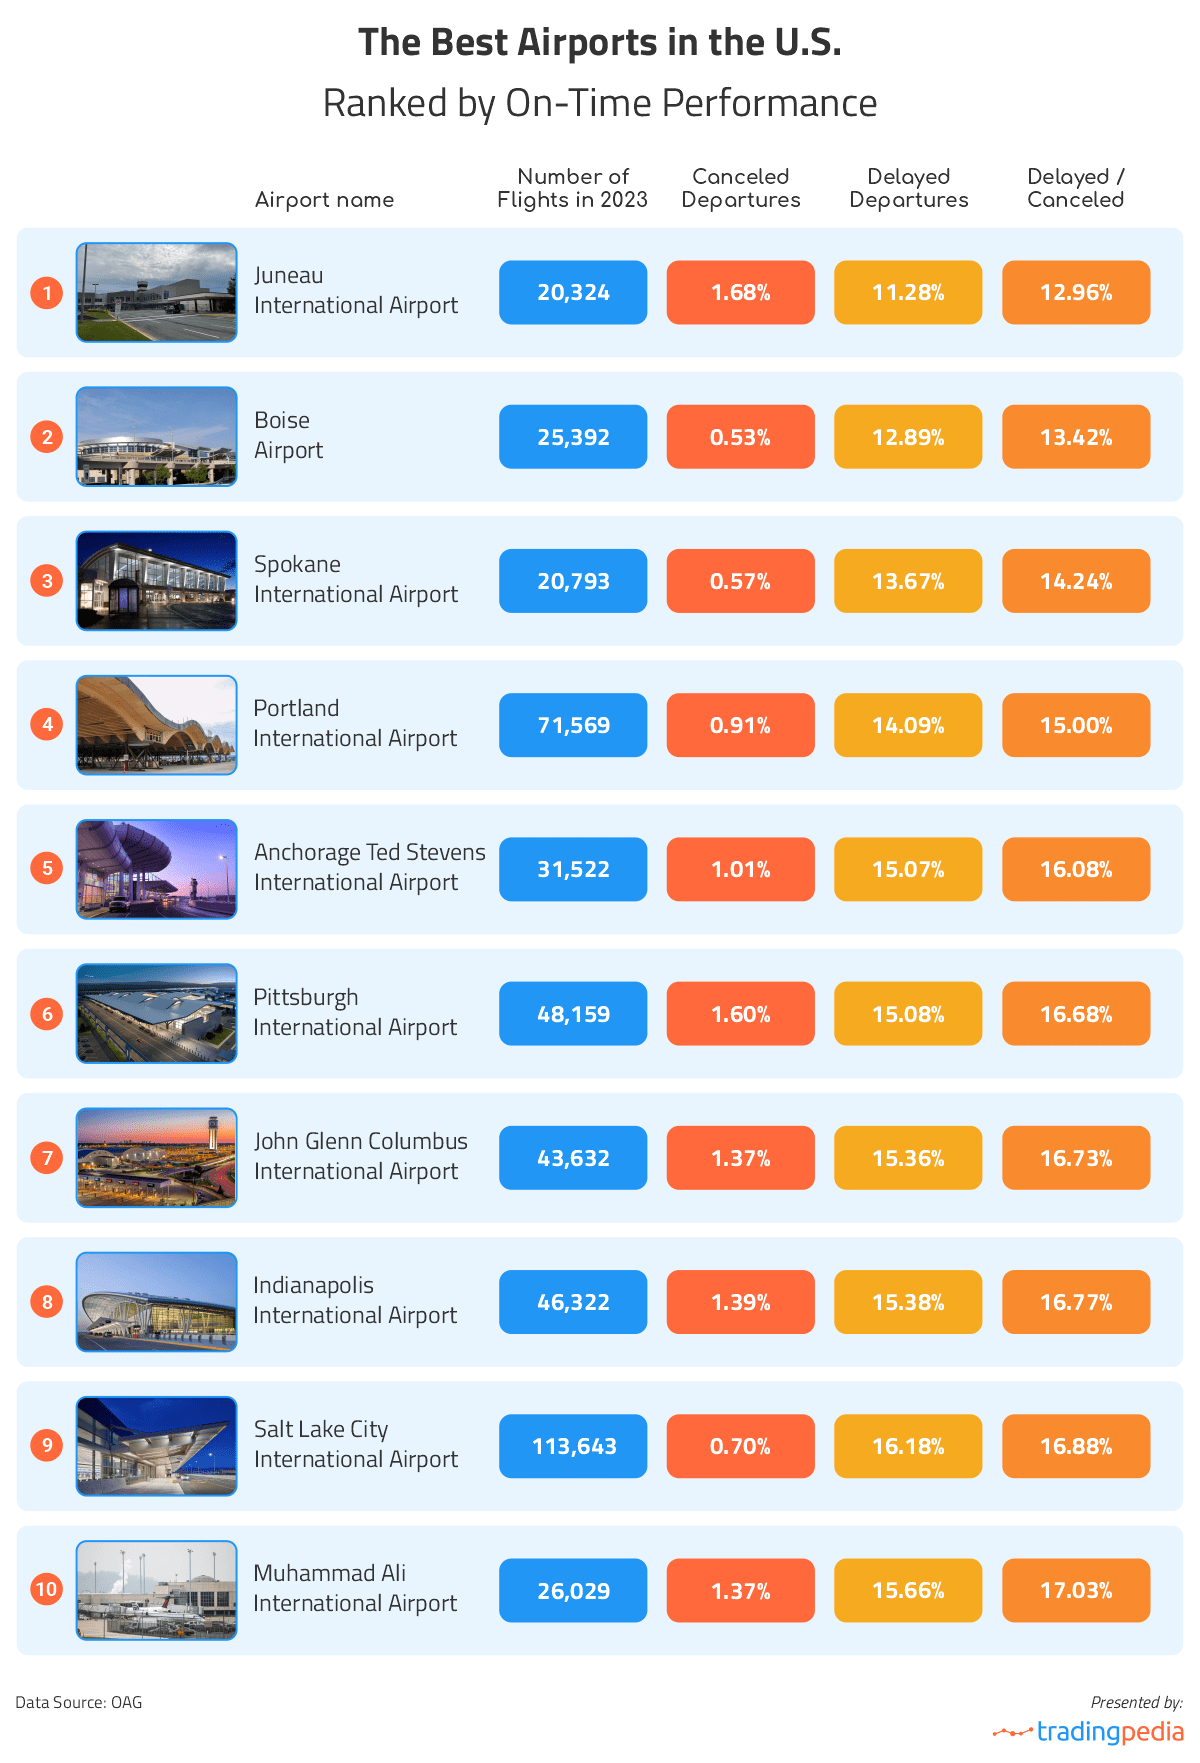
The best Airports in the U.S. based on flight delays and cancellations?
Data also shows that the most reliable airport in the U.S. is the Juneau International Airport where only 11.28% of departures were delayed last year and another 1.68% were canceled. It is a regional airport in Alaska and one of the smallest on our list. In fact, most of the ten best American airports in terms of on-time performance had less than 50,000 flights in 2023.
Flying in the 21st Century: Cheaper But More Stressful
Gone are the days when travelers dressed up and spent a little fortune on airfares to fly on some of the very few commercial flights available at the time to the public in the United States. As air travel became more popular – and affordable, flights became packed, less comfortable, and more stressful. While flying is the norm in the 21st century, it is also often associated with huge crowds at airports, long delays, and a host of inconveniences from missed connections, lost luggage, and canceled flights.
It is hardly surprising then that so many passengers nowadays view air travel as a stressful, rather than exciting experience. In December 2023 alone, the Transportation Security Administration (TSA) received 13,389 complaints from the general public, 10,638 of which were related to the screening of passengers, while 1,321 were about lack of courtesy of customer service.
The TSA, however, does not have customer feedback data related to delays or cancellations and these complaints are likely to be much more. According to the on-time performance statistics we analyzed for the twelve months of 2023 from OAG, 22.11% of the flights arrived late. Of the 8.2 million flights by U.S. carriers we examined, 1.7 million were classified as delayed (i.e. delays of 15 minutes or more). Over 109,000 flights were canceled, a rate of roughly 1.33%.
The reasons behind this poor performance range from bad weather to staff shortages. In May, bookings reached record numbers, which led to packed flights, crowded airports and crowded skies. Another increase in bookings was reported for the 4th of July and it resulted in overcrowded airports, over 6,500 delayed and about 1,900 canceled flights. The poor organization and tarmac delays affected hundreds of flights and thousands of passengers. In January, a network-wide system outage caused more than 1,300 cancellations, while over 9,500 flights were delayed. Moreover, staff shortages from air traffic control employees to pilots have been responsible for flight disruptions last year.
Severe weather also posed challenges for the aviation industry. The harsh winter last year delayed 7,600 flights and canceled at least 1,700. Thousands of passengers found themselves stuck at airports. In the summer, Canadian wildfires raged for days, with thick smoke reducing visibility around multiple airports in the northwestern U.S. Flights were stopped or delayed at LaGuardia Airport, Newark Liberty International Airport, and Philadelphia International Airport.
On June 26, more than 7,800 flights were delayed or canceled due to severe storms in the Southeast and the Ohio Valley. In August, Category 4 hurricane Idalia ripped through North Florida, leaving behind terrible devastation and a lot of casualties. The destructive storm grounded and disrupted many flights, affecting thousands of travelers.
The Airlines most likely to delay or cancel your flight
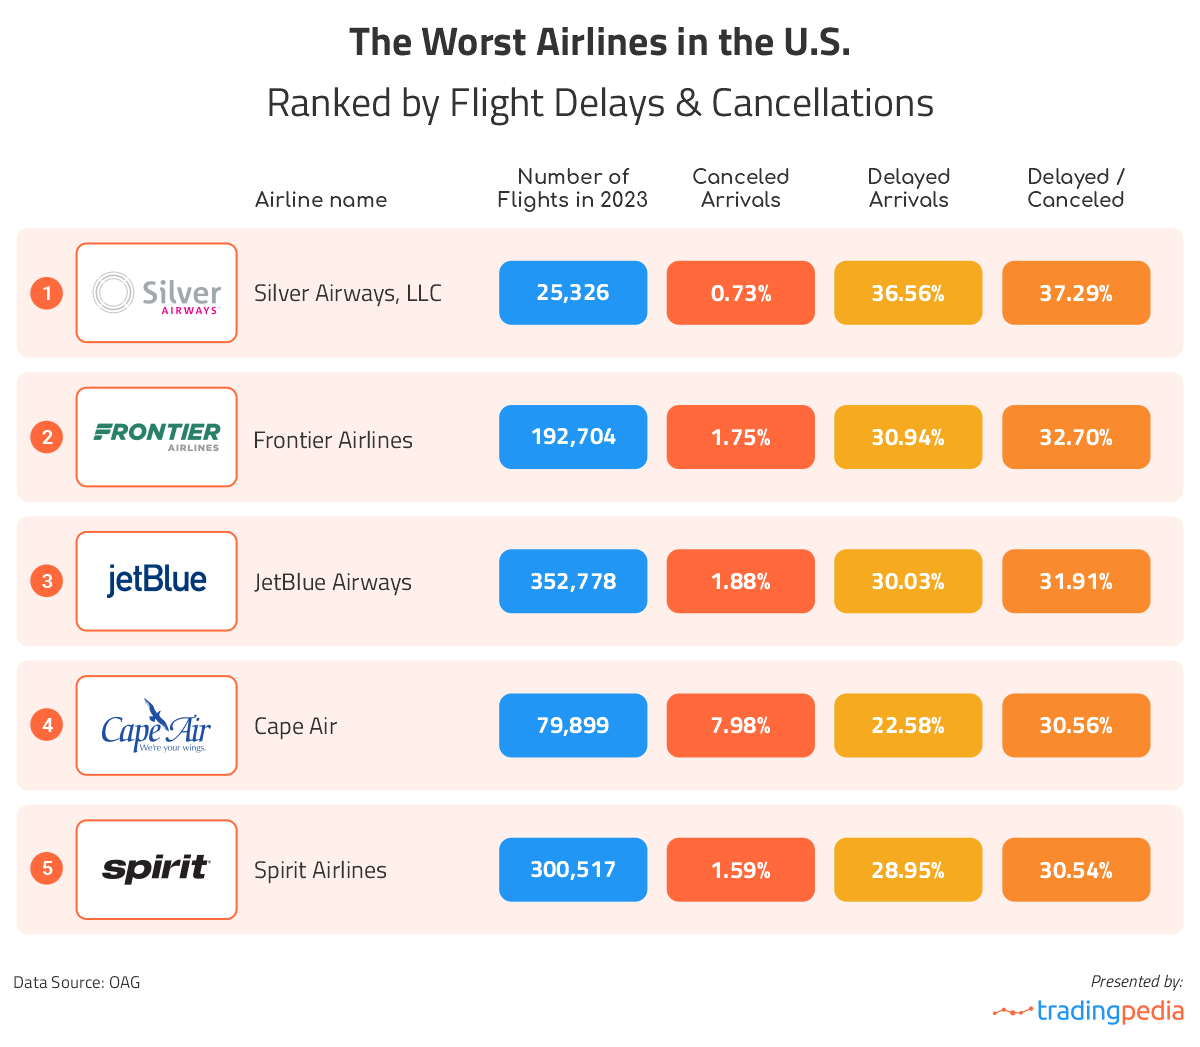
Of the 13 carriers we looked at, the worst one in terms of flight delays is Silver Airways, a local carrier based in Hollywood, Florida. In 2023, we calculate that 9,258 or 36.56% of its 25,326 flights arrived late. The cancellation rate was 0.73%, which means 185 flights were canceled.
The second-worst airline in terms of delays and cancellations in the U.S. is Frontier Airlines, an ultra-low-cost carrier headquartered in Denver, Colorado. Out of the 192,704 flights it operated in 2023, 59,630 or 30.94% were delayed. Another 3,378 flights or 1.75% were canceled. Third on the ranking is JetBlue, a major low-cost carrier based in Queens, New York City. We calculated that 105,936 of its 352,778 flights in 2023 arrived late, which is 30.03%. The cancellation rate was 1.88%, suggesting 6,640 of its flights were canceled.
Local carrier Cape Air ranks 4th on the list of American airlines with the most delays and cancellations with 69.44% of its flights last year arriving on time. It is a small carrier, headquartered at Cape Cod Gateway Airport in Hyannis, Massachusetts, and it operates scheduled passenger services in the Northeast, the Midwest, Eastern Montana, as well as in the Caribbean. According to our analysis, Cape Air has the highest cancellation rate in the U.S. at 7.98%. Also, 22.58% of its flights last year arrived late.
There is one more carrier with less than 70% on-time arrivals for 2023 on this list and it is Spirit Airlines. Based in Miramar, Florida, Spirit is an ultra-low-cost airline and 28.95% of the 300,517 flights it operated in 2023 were delayed. Another 1.59% were canceled.
The Airports with the most flight delays and cancellations in the U.S.
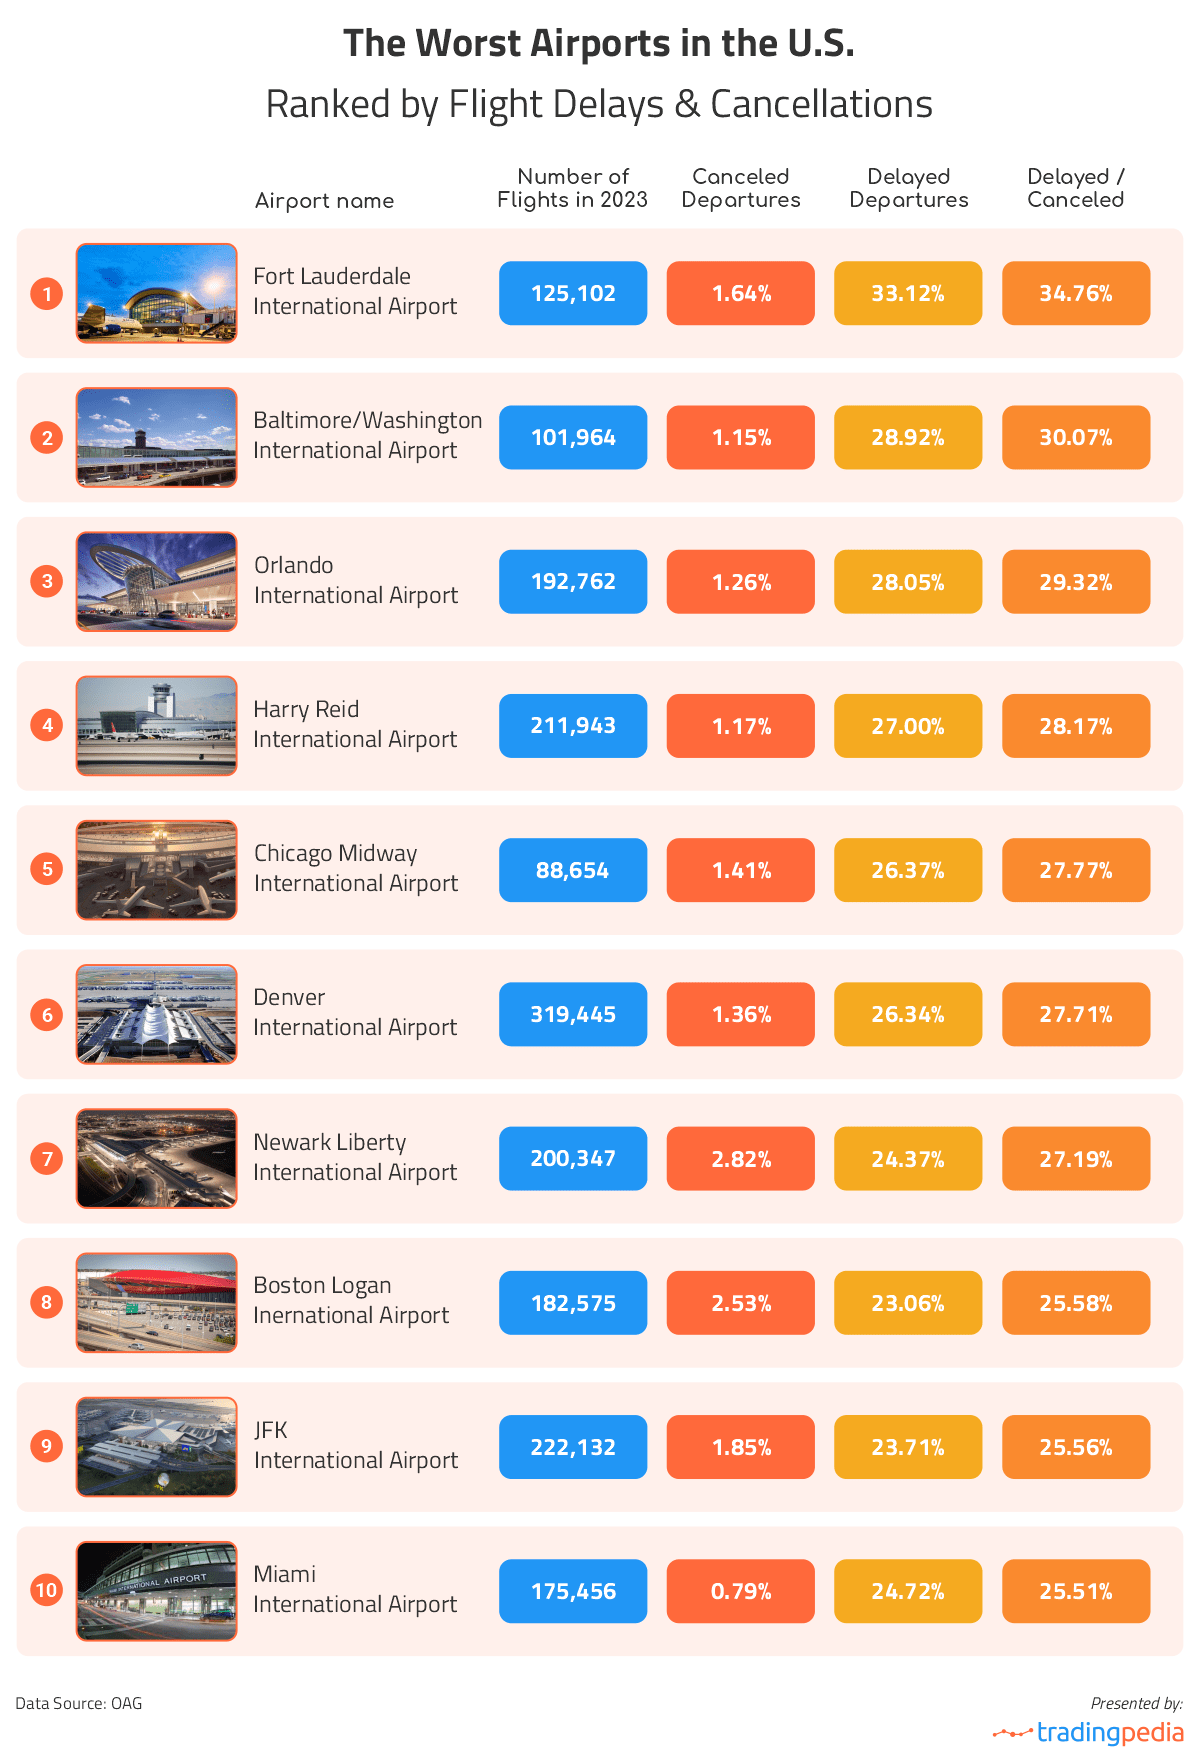
We also looked at the on-time performance statistics for U.S. airports from OAG. Once again, we only included those airports that had a minimum of 20,000 flights in 2023. According to our calculations, the airport with the most delays and cancellations last year was Fort Lauderdale-Hollywood International Airport in Florida, which had 125,102 flights in 2023. Of those, 41,435 departures were delayed, which is 33.12%, whereas 2,053 flights or 1.64% were canceled. The airport is a major transportation hub and a base for Allegiant Air, JetBlue and Spirit Airlines.
The Baltimore/Washington International Airport ranks as the second-worst airport in the country in terms of on-time performance. It is one of three major airports, together with Dulles International Airport and Ronald Reagan Washington National Airport, serving the Washington–Baltimore metropolitan area. In 2021, it became the busiest airport in the area and the 22nd busiest in the U.S. In 2023, it had 28.92% delayed departures, while the cancellation rate was 1.15%.
Orlando International Airport ranks third with 28.05% of all 192,762 departures being delayed last year. Around 1.26% of flights were canceled. Fourth on the list is Harry Reid International Airport in Las Vegas with 27% delayed and 1.17% canceled flights. Chicago Midway International Airport follows in fifth position with 26.37% of departures being delayed and another 1.41% canceled.
Methodology
For this analysis, the team at Tradingpedia looked at the OTP database (on-time performance) for airlines and airports by OAG, a UK-based provider of aviation industry data and intelligence. We accessed the OTP reports for the twelve months of 2023 and calculated the delay and cancellation rates for the entire year, focusing exclusively on American carriers and airports.
To avoid comparing major airlines with small ones that fly several times per year, however, we only included airlines and airports with more than 20,000 flights for 2023. This left us with a total of 13 airlines and 70 airports in the United States. But what are flight delays exactly? Airports keep a record of departures that were delayed 15 minutes or more. For airlines, the term “delay” refers to those flights arriving 15 minutes or more after the scheduled time.
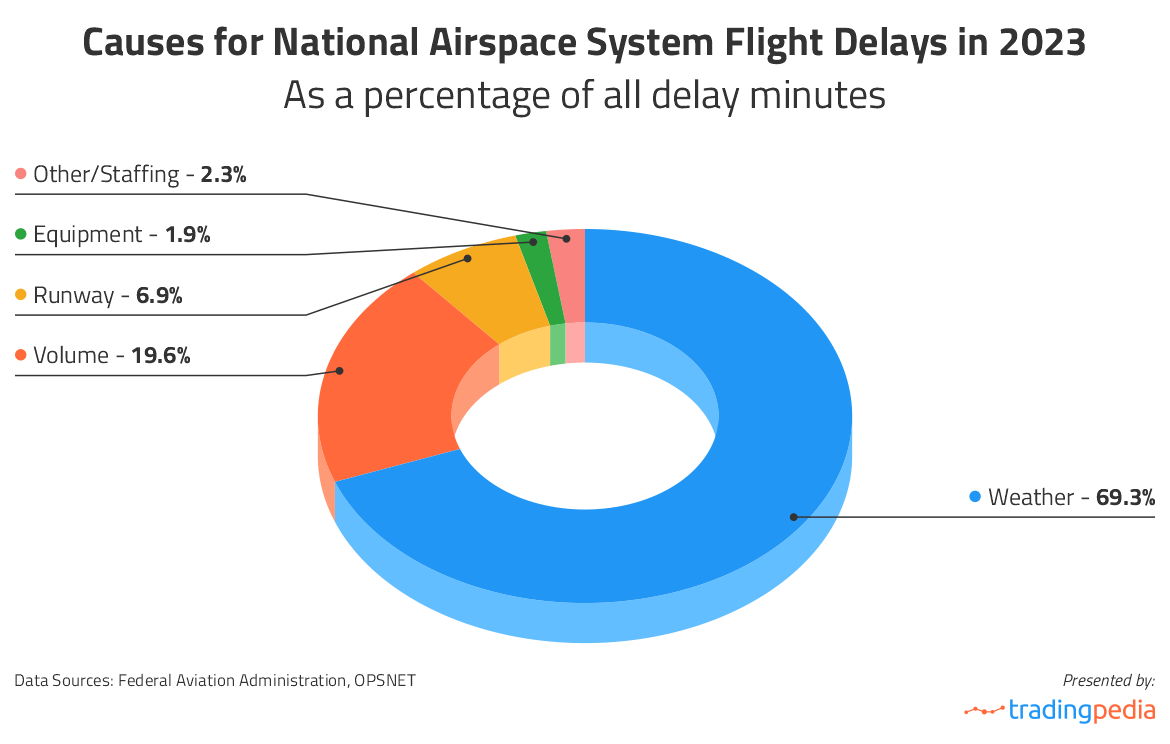
We also sourced data from the Federal Aviation Administration and its Operations Network (OPSNET), which provides data for air traffic operations and delays.