
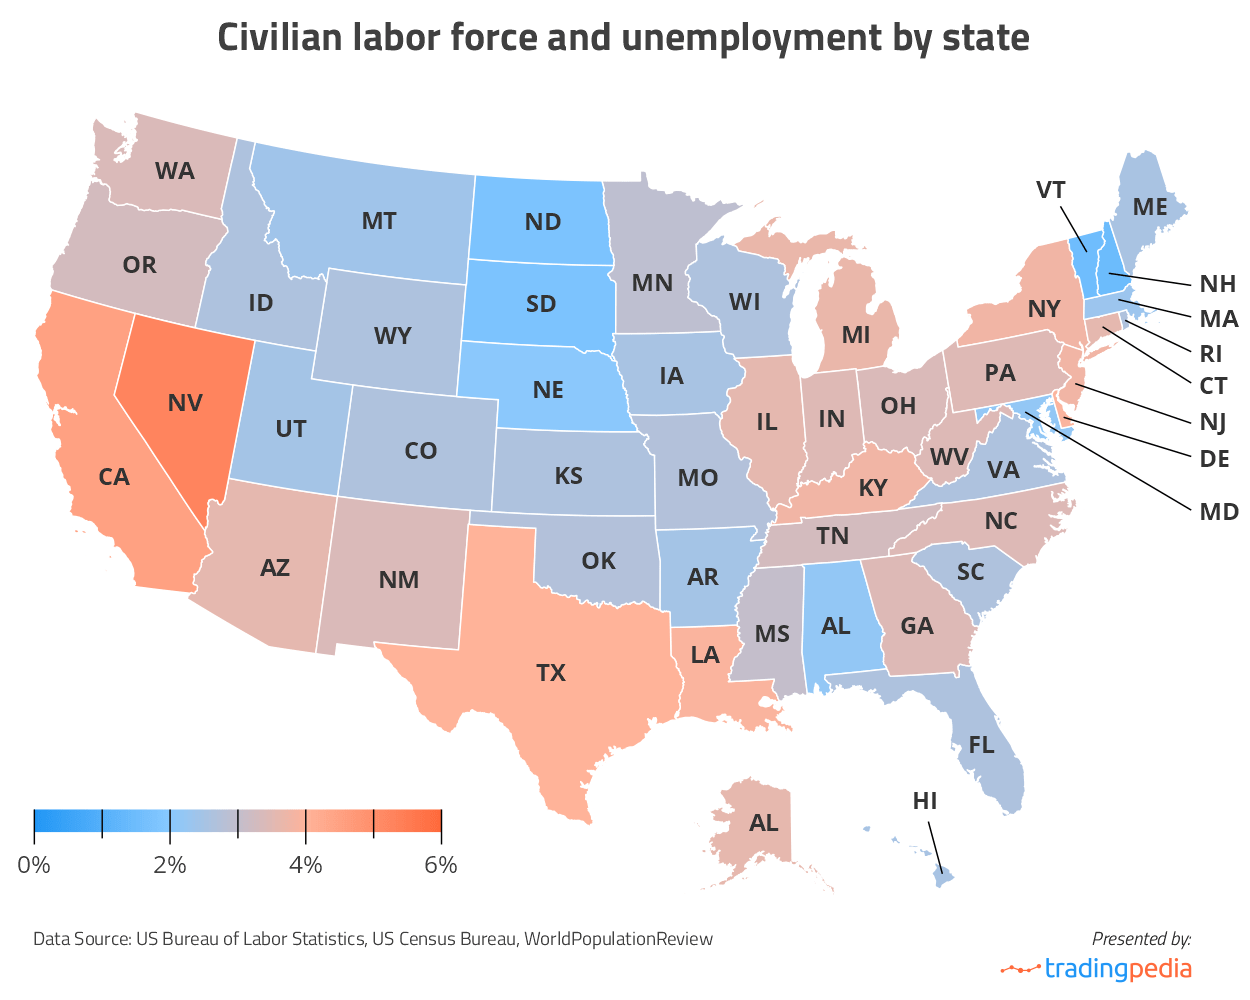
Despite the challenges the US economy is facing this year, following the turmoil around the debt ceiling deal, the high interest rates, and the sudden collapse of high-profile regional banks, the country’s labor market has remained relatively stable. Compared to the same time last year, the average unemployment rate has gone up by just 0.1 per cent – 3.7% up from 3.6%.
However, a closer look at the latest Metropolitan Area Employment and Unemployment news release published by the US Bureau of Labor Statistics shows that while some states are performing really well others are really struggling. For example in May 2022 California and Texas were occupying the 15th and 16th spots with 3.66% and 3.64% Unemployment Rate respectively. A year later these rates jumped to 4.48% and 4.10% respectively and California and Texas are currently at the #2 and #3 spots.
These considerable swings spurred the team at TradingPedia to further analyze the matter. The current report highlights the five states with the highest rates of unemployment. It also includes data on the five states with the lowest rates and the one which has achieved the strongest progress since May 2022.
| Rk 2023 | State | Rk 2022 | Population 2022 | Population 2023 | Groth Rate | Civilian labor force May 2022 | Civilian labor force May 2023 | Unemployed May 2022 | Unemployment Percentage May 2022 | Unemployed May 2023 | Unemployment Percentage May 2023 |
|---|---|---|---|---|---|---|---|---|---|---|---|
| 1 | Nevada | 1 | 3,209,142 | 3,177,772 | 0.99% | 1,547,500 | 1,586,849 | 81,089 | 5.24% | 83,602 | 5.27% |
| 2 | California | 15 | 38,915,693 | 39,029,342 | -0.29% | 19,196,922 | 19,307,961 | 701,685 | 3.66% | 864,609 | 4.48% |
| 3 | Texas | 16 | 30,500,280 | 30,029,572 | 1.57% | 14,616,414 | 14,968,635 | 531,312 | 3.64% | 613,801 | 4.10% |
| 4 | Delaware | 6 | 1,031,985 | 1,018,396 | 1.33% | 494,975 | 502,102 | 20,177 | 4.08% | 19,698 | 3.92% |
| 5 | Louisiana | 20 | 4,553,384 | 4,590,241 | -0.80% | 2,087,581 | 2,106,815 | 72,898 | 3.49% | 82,195 | 3.90% |
| 6 | New Jersey | 19 | 9,255,437 | 9,261,699 | -0.07% | 4,719,435 | 4,850,755 | 166,718 | 3.53% | 186,937 | 3.85% |
| 7 | Kentucky | 10 | 4,518,031 | 4,512,310 | 0.13% | 2,053,884 | 2,062,436 | 78,429 | 3.82% | 79,345 | 3.85% |
| 8 | New York | 7 | 19,496,810 | 19,677,151 | -0.92% | 9,611,179 | 9,723,029 | 379,712 | 3.95% | 372,547 | 3.83% |
| 9 | Michigan | 4 | 10,030,722 | 10,034,113 | -0.03% | 4,853,063 | 4,970,486 | 200,435 | 4.13% | 186,699 | 3.76% |
| 10 | Alaska | 8 | 732,984 | 733,583 | -0.08% | 358,446 | 357,670 | 14,063 | 3.92% | 13,328 | 3.73% |
| 11 | Connecticut | 3 | 3,629,055 | 3,626,205 | 0.08% | 1,944,890 | 1,886,359 | 80,875 | 4.16% | 69,474 | 3.68% |
| 12 | Arizona | 13 | 7,453,517 | 7,359,197 | 1.28% | 3,603,906 | 3,686,820 | 133,129 | 3.69% | 134,276 | 3.64% |
| 13 | Illinois | 2 | 12,477,595 | 12,582,032 | -0.83% | 6,455,149 | 6,378,771 | 281,171 | 4.36% | 231,418 | 3.63% |
| 14 | Indiana | 35 | 6,852,542 | 6,833,037 | 0.29% | 3,405,791 | 3,421,867 | 95,120 | 2.79% | 121,060 | 3.54% |
| 15 | Pennsylvania | 5 | 12,931,957 | 12,972,008 | -0.31% | 6,504,345 | 6,493,270 | 266,285 | 4.09% | 229,662 | 3.54% |
| 16 | Georgia | 31 | 11,037,723 | 10,912,876 | 1.14% | 5,228,331 | 5,299,480 | 149,025 | 2.85% | 181,756 | 3.43% |
| 17 | North Carolina | 18 | 10,832,061 | 10,698,973 | 1.24% | 5,178,101 | 5,249,919 | 184,479 | 3.56% | 179,804 | 3.42% |
| 18 | West Virginia | 21 | 1,764,786 | 1,775,156 | -0.58% | 788,108 | 784,480 | 27,388 | 3.48% | 26,708 | 3.40% |
| 19 | Ohio | 14 | 11,747,774 | 11,756,058 | -0.07% | 5,762,614 | 5,850,786 | 211,387 | 3.67% | 197,922 | 3.38% |
| 20 | New Mexico | 9 | 2,110,011 | 2,113,344 | -0.16% | 943,758 | 952,661 | 36,656 | 3.88% | 32,038 | 3.36% |
| 21 | Washington | 11 | 7,830,827 | 7,785,786 | 0.58% | 3,967,534 | 4,048,898 | 149,185 | 3.76% | 134,024 | 3.31% |
| 22 | Tennessee | 26 | 7,134,327 | 7,051,339 | 1.18% | 3,375,814 | 3,370,833 | 106,909 | 3.17% | 109,428 | 3.25% |
| 23 | Oregon | 23 | 4,223,973 | 4,240,137 | -0.38% | 2,157,494 | 2,126,788 | 72,603 | 3.37% | 68,105 | 3.20% |
| 24 | Mississippi | 12 | 2,930,528 | 2,940,057 | -0.32% | 1,258,261 | 1,242,868 | 47,145 | 3.75% | 37,388 | 3.01% |
| 25 | Minnesota | 46 | 5,722,897 | 5,717,184 | 0.10% | 3,076,643 | 3,119,942 | 66,382 | 2.16% | 91,700 | 2.94% |
| 26 | Missouri | 42 | 6,186,091 | 6,177,957 | 0.13% | 3,069,864 | 3,139,913 | 69,447 | 2.26% | 90,820 | 2.89% |
| 27 | Oklahoma | 28 | 4,048,375 | 4,019,800 | 0.71% | 1,890,935 | 1,928,641 | 55,869 | 2.95% | 55,196 | 2.86% |
| 28 | South Carolina | 29 | 5,372,002 | 5,282,634 | 1.69% | 2,383,773 | 2,446,950 | 70,355 | 2.95% | 68,736 | 2.81% |
| 29 | Colorado | 36 | 5,868,555 | 5,839,926 | 0.49% | 3,186,795 | 3,236,746 | 86,830 | 2.72% | 90,877 | 2.81% |
| 30 | Rhode Island | 32 | 1,090,483 | 1,093,734 | -0.30% | 569,184 | 569,568 | 16,142 | 2.84% | 15,817 | 2.78% |
| 31 | Wyoming | 22 | 583,279 | 581,381 | 0.33% | 290,111 | 297,071 | 9,911 | 3.42% | 8,108 | 2.73% |
| 32 | Idaho | 40 | 1,973,752 | 1,939,033 | 1.79% | 950,770 | 965,118 | 22,303 | 2.35% | 26,004 | 2.69% |
| 33 | Kansas | 38 | 2,936,378 | 2,937,150 | -0.03% | 1,500,797 | 1,518,343 | 36,614 | 2.44% | 40,894 | 2.69% |
| 34 | Florida | 37 | 22,661,577 | 22,244,823 | 1.87% | 10,741,092 | 11,021,589 | 292,321 | 2.72% | 296,052 | 2.69% |
| 35 | Wisconsin | 33 | 5,904,977 | 5,892,539 | 0.21% | 3,074,106 | 3,119,249 | 86,428 | 2.81% | 83,578 | 2.68% |
| 36 | Virginia | 30 | 8,709,873 | 8,683,619 | 0.30% | 4,436,434 | 4,607,280 | 127,927 | 2.88% | 123,312 | 2.68% |
| 37 | Hawaii | 24 | 1,433,238 | 1,440,196 | -0.48% | 673,796 | 671,927 | 21,733 | 3.23% | 17,744 | 2.64% |
| 38 | Iowa | 41 | 3,203,345 | 3,200,517 | 0.09% | 1,707,944 | 1,737,711 | 39,033 | 2.29% | 45,806 | 2.64% |
| 39 | Maine | 34 | 1,393,442 | 1,385,340 | 0.58% | 673,215 | 678,412 | 18,923 | 2.81% | 17,653 | 2.60% |
| 40 | Arkansas | 25 | 3,063,152 | 3,045,637 | 0.57% | 1,371,738 | 1,384,271 | 43,450 | 3.17% | 34,372 | 2.48% |
| 41 | Utah | 43 | 3,422,487 | 3,380,800 | 1.23% | 1,737,045 | 1,812,321 | 38,517 | 2.22% | 44,671 | 2.46% |
| 42 | Montana | 39 | 1,139,507 | 1,122,867 | 1.48% | 567,905 | 579,106 | 13,415 | 2.36% | 13,839 | 2.39% |
| 43 | Massachusetts | 17 | 6,974,258 | 6,981,974 | -0.11% | 3,726,911 | 3,682,046 | 134,145 | 3.60% | 84,244 | 2.29% |
| 44 | Maryland | 27 | 6,154,710 | 6,164,660 | -0.16% | 3,157,874 | 3,191,400 | 97,863 | 3.10% | 70,018 | 2.19% |
| 45 | Alabama | 45 | 5,098,746 | 5,074,296 | 0.48% | 2,286,230 | 2,307,803 | 50,476 | 2.21% | 49,384 | 2.14% |
| 46 | Nebraska | 48 | 1,972,292 | 1,967,923 | 0.22% | 1,062,770 | 1,065,527 | 22,263 | 2.09% | 21,970 | 2.06% |
| 47 | North Dakota | 50 | 780,588 | 779,261 | 0.17% | 415,619 | 421,229 | 7,185 | 1.73% | 7,980 | 1.89% |
| 48 | South Dakota | 49 | 923,484 | 909,824 | 1.50% | 477,236 | 484,604 | 8,977 | 1.88% | 9,034 | 1.86% |
| 49 | Vermont | 44 | 647,156 | 647,064 | 0.01% | 340,106 | 341,510 | 7,532 | 2.21% | 5,707 | 1.67% |
| 50 | New Hampshire | 47 | 1,402,957 | 1,395,231 | 0.55% | 760,641 | 752,116 | 15,970 | 2.10% | 11,453 | 1.52% |
Methodology
We analysed information provided by the following official data sources:
Employment and unemployment figures are based on the official place of residence of the citizens, and this analysis includes the civilian non-institutional population aged 16 and older. The civilian labor force is equal to the sum of the numbers of employed and unemployed persons. The unemployment rate presents the unemployed population as a percentage of the civilian labor force.
Nevada is a Workforce Paradox
At state level, Nevada tops the ranking as the state with the highest unemployment rate both in May 2022 and May 2023. According to the US Bureau of Labor Statistics, the state’s unemployment rate has not seen any significant change compared to the same period last year – 5.24% vs 5.27%. Given the announcement of reaching the target of 1.5 million U.S jobs in March 2023, which lead to a record-high increase in employment, this is somewhat surprising. The explanation lies in another key indicator; labor force participation rate (the labor force as a percentage of the civilian non-institutional population) which has jumped from 61.2% to 61.8% since May 2022.
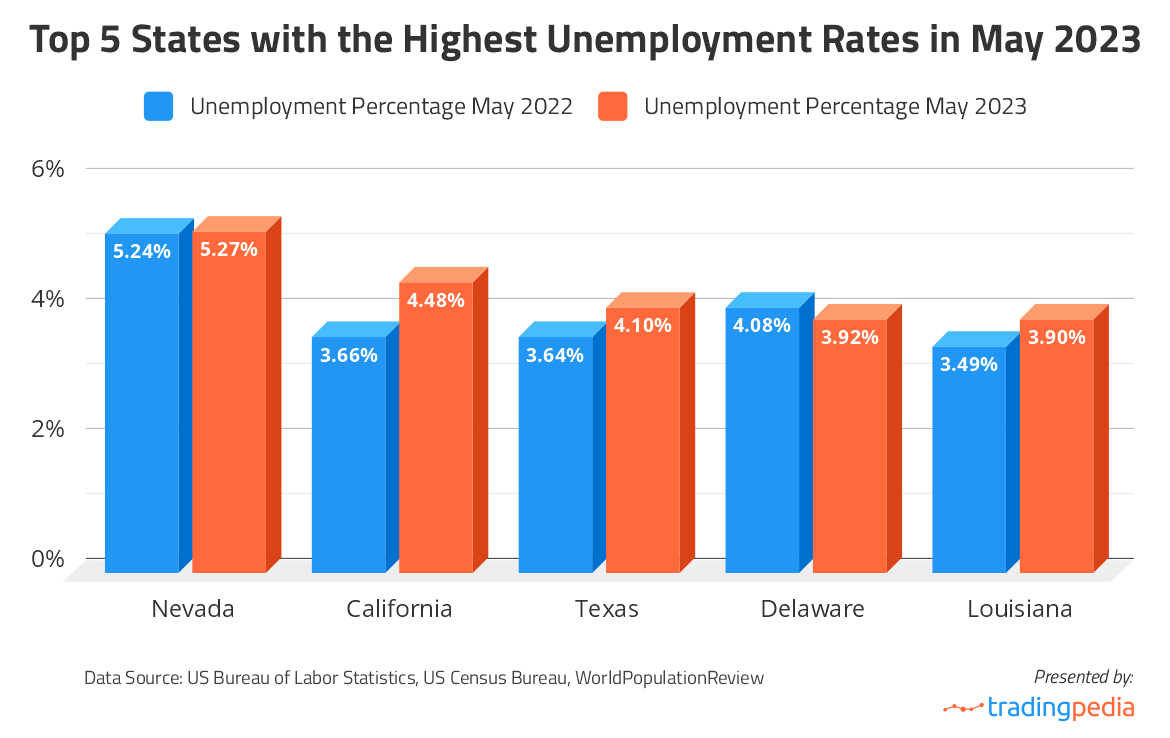
The state with the second highest unemployment rate, California, is a totally different case. This is the state with the highest unemployment rate increase compared to the same time last year – 4.48% up from 3.66%. The recent rise in seasonally adjusted jobs has had little effect on the overall level, mainly due to the continued layoffs in technology and other industry sectors.
The third position on the current list is held by Texas, with the employment situation nearly the same as in California. According to the Texas Workforce Commission, the state has crossed the 15 million threshold in terms of the seasonally adjusted labor force. However, its overall unemployment range has moved up to 4.1% from 3.64% in May 2022.
Although Delaware is one of the 5 states with the highest unemployment rate as of May 2023, it is seeing a positive trend. According to the US Bureau of Labor Statistics, the state’s unemployment rate has decreased from 4.08% to 3.92% during the study period. A check with the Delaware Department of Labor shows that the largest number of people are employed in the Education & Health Services industry (16.5%), followed by Government (14.2%), and Retail Trade (10.4%).
While not showing as large a percentage difference as California, Louisiana has also seen a significant increase in its unemployed population. In May 2022, the state was in the 20th position with 3.49% but climbed to the 5th place in May 2023, with 3.90% of its civilian labor force being jobless. The labor force participation rate plays a part here, increasing from 58.6% to 59.3% within the study period.
States with the Lowest Unemployment Rates
Five states are on the opposite side of the labor market spectrum – Nebraska, North Dakota, South Dakota, Vermont, and New Hampshire. Not only did they have the lowest unemployment rates in May 2023 (2.06%, 1.89%, 1.86%, 1.67%, and 1.52%) but they were among the best-performing states a year ago, too.
As impressive as these figures are, the progress achieved by Massachusetts since May 2022 surpasses all others. A year ago, it was the 17th most jobless state with an unemployment rate of 3.60%. At the time of the current study, Massachusetts holds the 43rd position with an unemployment percentage of 2.29%, the most positive change of all 50 states.