The Most Affordable US States
and Cities for Tenants
The U.S. rental market has moved into a slower phase in 2026, after several years of rapid and uneven increases. Price growth has cooled across most metropolitan areas, and in some cities, rents have begun to decline as new units enter the market. Yet, the broader affordability picture remains largely unchanged. The slowdown has arrived after a period of sustained growth that pushed rent levels materially higher, while income growth has not kept pace. As a result, the market is stabilizing, but at a cost that remains difficult for many households to absorb.
To capture the true state of housing affordability, TradingPedia compared median rent levels with average local incomes across US cities and states. The analysis ranks locations by rent-to-income ratios in 2026, using the latest available income data as of February and rent movements through April. It highlights where rental burdens are most severe, where incomes provide the greatest cushion, and which markets have experienced the sharpest shifts in rent costs so far this year.
Share of Average Monthly Earnings Spent on Rent by U.S. State
(Based on Average Salary and Rent Data, February 2026)
Data Source: ApartmentList, U.S. Bureau of Labor Statistics
At the state level, the burden is heavily concentrated in high-cost coastal and high-income regions, with Hawaii and California having rents that take up the largest share of average incomes at 43.4% and 38.2%, respectively. Affordability levels are also low in Virginia (36.47%), New Jersey (35.89%), and New York (35.87%). Despite boasting the fourth highest average monthly earnings at $5,677, the cost of living in California remains a defining issue, with nearly 1 million residents relocating to the more inexpensive state of Texas between 2009 and 2025, according to a January report in The New York Post. In New York, persistently high living costs have contributed to a net outflow of 114,000 residents from New York City, underlining the limits of recent policy efforts to contain housing costs. Meanwhile, in parts of Virginia and other mid-Atlantic markets, inward migration from higher-cost urban centers has tightened rental conditions in previously more affordable areas, pushing rents higher and reducing vacancies.
A wide cluster of states now sits tightly between roughly 24% and 27% of monthly earnings spent on rent, suggesting a growing convergence in “middle America” affordability conditions. This pattern aligns with broader national trends in 2026, where rent growth has slowed to its weakest pace in years as supply increases and demand normalizes, yet overall price levels remain elevated. Even traditionally lower-cost states such as Florida and Illinois, where average earnings are relatively high at around $4,960 per month, now sit near the 30% threshold, suggesting that housing pressure is no longer confined to a handful of coastal markets. In Florida, rising living costs and housing expenses have begun to slow migration and even push some residents out, marking a reversal from its pandemic-era boom.
The result is a shift away from the traditional view that coastal areas are inherently unaffordable while inland markets offer accessible living. Instead, affordability is increasingly shaped by a more complex set of factors, including stagnant income growth, shifting migration patterns, evolving construction dynamics, and a persistently high baseline of rents.
Most Affordable Cities for Rent Relative to Income as of February 2026
At the lower end of the affordability-to-income ratio, smaller cities across Texas, the Midwest and parts of the Mountain West continue to offer significantly lower rent burdens. In places such as Seguin, Temple and Toledo, renters spend less than 20% of their average monthly earnings, with incomes at roughly $5,169 in Texas and $4,651 in Ohio. This reflects an ongoing trend in which secondary markets have remained relatively insulated from the sharp rent increases seen during the pandemic years, largely due to more elastic housing supply and slower population inflows.
In Texas, in particular, strong construction activity has helped keep rents comparatively low even as the state continues to attract new residents. At the same time, Midwestern cities such as Toledo benefit from stable rent levels despite modest wage growth, reinforcing their position as some of the most accessible rental markets in the country. However, this relative affordability is not necessarily improving – rather, it reflects markets where rents have risen more slowly, not where incomes have surged.
Least Affordable Cities for Rent Relative to Income as of February 2026
The least affordable cities are overwhelmingly concentrated in California, where rent burdens exceed 55% of average monthly earnings in several locations, including San Mateo, Newport Beach, and Sunnyvale. These figures reflect intense cost pressures in tech-driven housing markets, where constrained supply, high-income competition, and sustained demand continue to support elevated rent levels, despite a broader national slowdown. In tech hubs such as San Francisco and Mountain View, rents remain among the highest in the country, even as price growth has moderated.
Similar dynamics are now emerging beyond California, with areas such as Lorton, Virginia, also ranking among the least affordable. This reflects the spillover of high housing costs into adjacent high-income regions, compounded by comparatively moderate average earnings in the state, which stand at around $4,796 per month. While rent growth has eased in 2026, prices remain near historic highs in many major markets, resulting in segments of the market where affordability is no longer marginally strained but structurally misaligned with local earnings.
States Where Rents Increased the Most
(April 2025-April 2026)
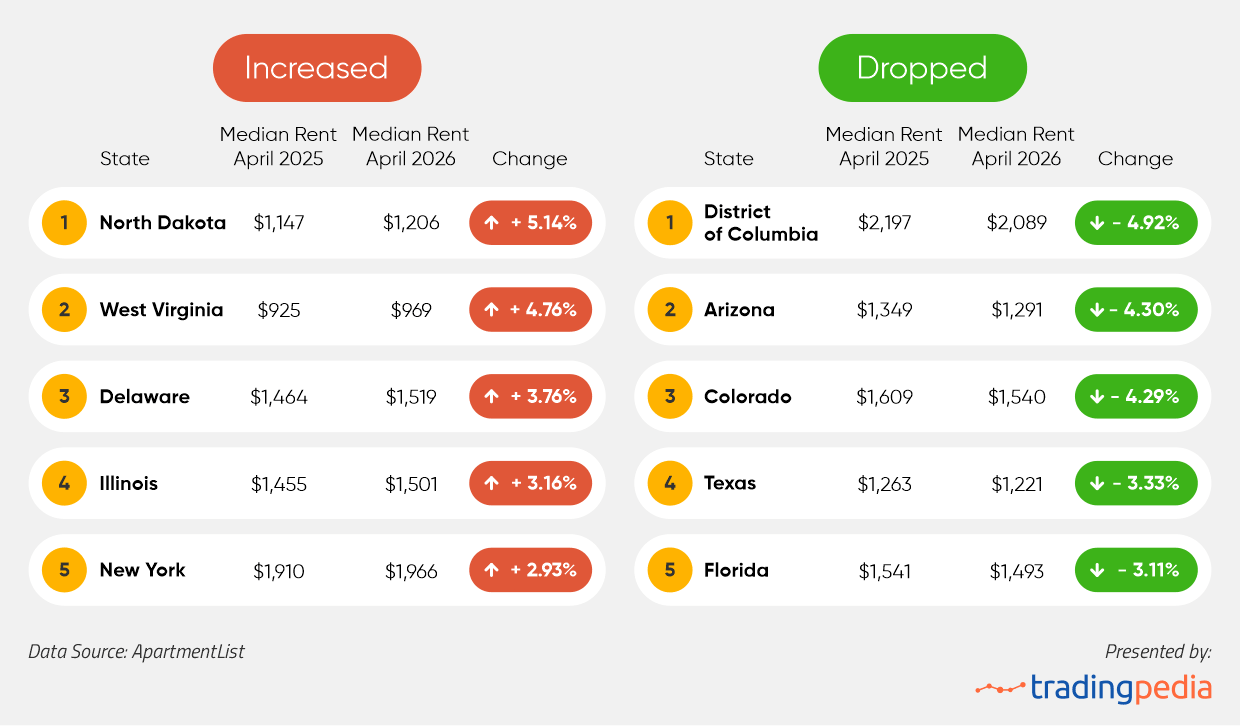
Year-over-year rent changes are not moving in the same direction across the country. In smaller markets such as North Dakota (+5.14%) and West Virginia (+4.76), rents are still rising, as even limited shifts in demand have a visible impact on prices. In contrast, several of the largest markets are now seeing declines. The most pronounced drops are in the District of Columbia (-4.92%), Arizona (-4.30%), Colorado (-4.29%), Texas (-3.33%), and Florida (-3.11%), where a wave of new construction has added a significant number of units and eased pressure on rents.
The outcome is a market that no longer moves as one. Places that expanded quickly are now adjusting, while tighter markets continue to see rents increase. Differences between regions are becoming more pronounced, with local conditions playing a larger role than before.
Cities Where Rents Increased the Most
(April 2025-April 2026)
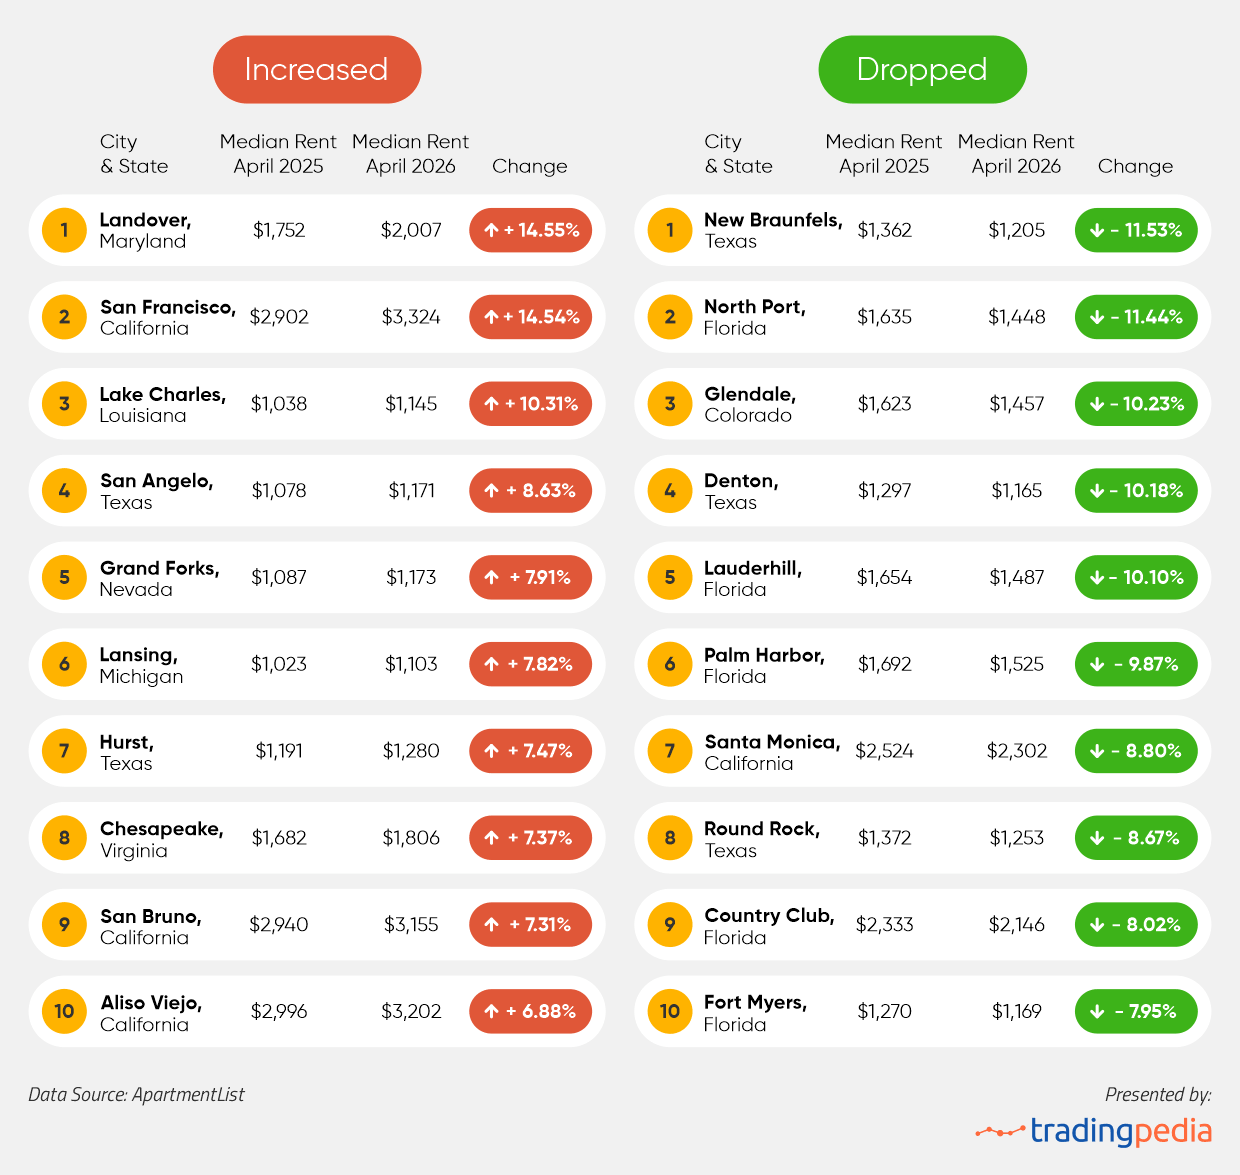
At the city level, the sharpest rent increases reflect a mix of localized economic rebounds and structural constraints. In San Francisco (+14.54%), rents have risen sharply as high-income tech hiring, particularly linked to artificial intelligence, has begun to pull workers back into the city, tightening demand in premium rental segments. This rebound is also visible in nearby cities such as San Bruno (+7.31%), where proximity to major employers and limited new housing supply continue to support rent growth.
In Landover (+14.55%), Maryland, increases are more closely tied to spillover demand from the Washington, DC metro area, where shifting workplace patterns and population redistribution are putting pressure on adjacent suburban markets. Meanwhile, in smaller cities such as Grand Forks, North Dakota, and Lake Charles, Louisiana, relatively thin housing inventory means even modest demand increases can drive outsized rent gains, particularly in areas influenced by energy, logistics or university-driven employment cycles.
On the downside, the sharpest rent declines are concentrated in cities that expanded rapidly during the pandemic and are now facing oversupply. In New Braunfels (-11.53%), Denton (-10.18%), and Round Rock (-8.67%), falling rents reflect a wave of new apartment completions across Texas, where aggressive construction pipelines have begun to outpace current demand. Florida markets such as Fort Myers (-7.95%) and North Port (-11.44%) are also adjusting, with local reports pointing to a slowdown in migration and rising insurance costs weighing on housing demand.
Even in high-cost coastal locations such as Santa Monica, rents have declined, suggesting that price corrections are now reaching segments of the market that had previously remained insulated. In some urban areas, this adjustment is further reinforced by structural shifts in real estate use, with underperforming commercial properties increasingly being converted into residential units, adding incremental supply and easing pressure in specific submarkets.

This report analyzes rental affordability across 49 U.S. states and the District of Columbia, with Vermont excluded due to insufficient data. At the city level, the analysis covers 644 locations.
Median rent data by state, city, and apartment type was sourced from Apartment List, using the latest available figures up to April 2026. This data was also used to calculate year-over-year rent changes. Average earnings data was obtained from U.S. Bureau of Labor Statistics (the latest, February 2026 release). Average income was used instead of median due to the lack of consistent state-level median data across all locations. To ensure consistency in the rent-to-income comparison, February was used as the reference month for both metrics.
Affordability was measured by calculating rent as a percentage of average monthly wages, allowing for direct comparisons across states and cities and consistent visualization.