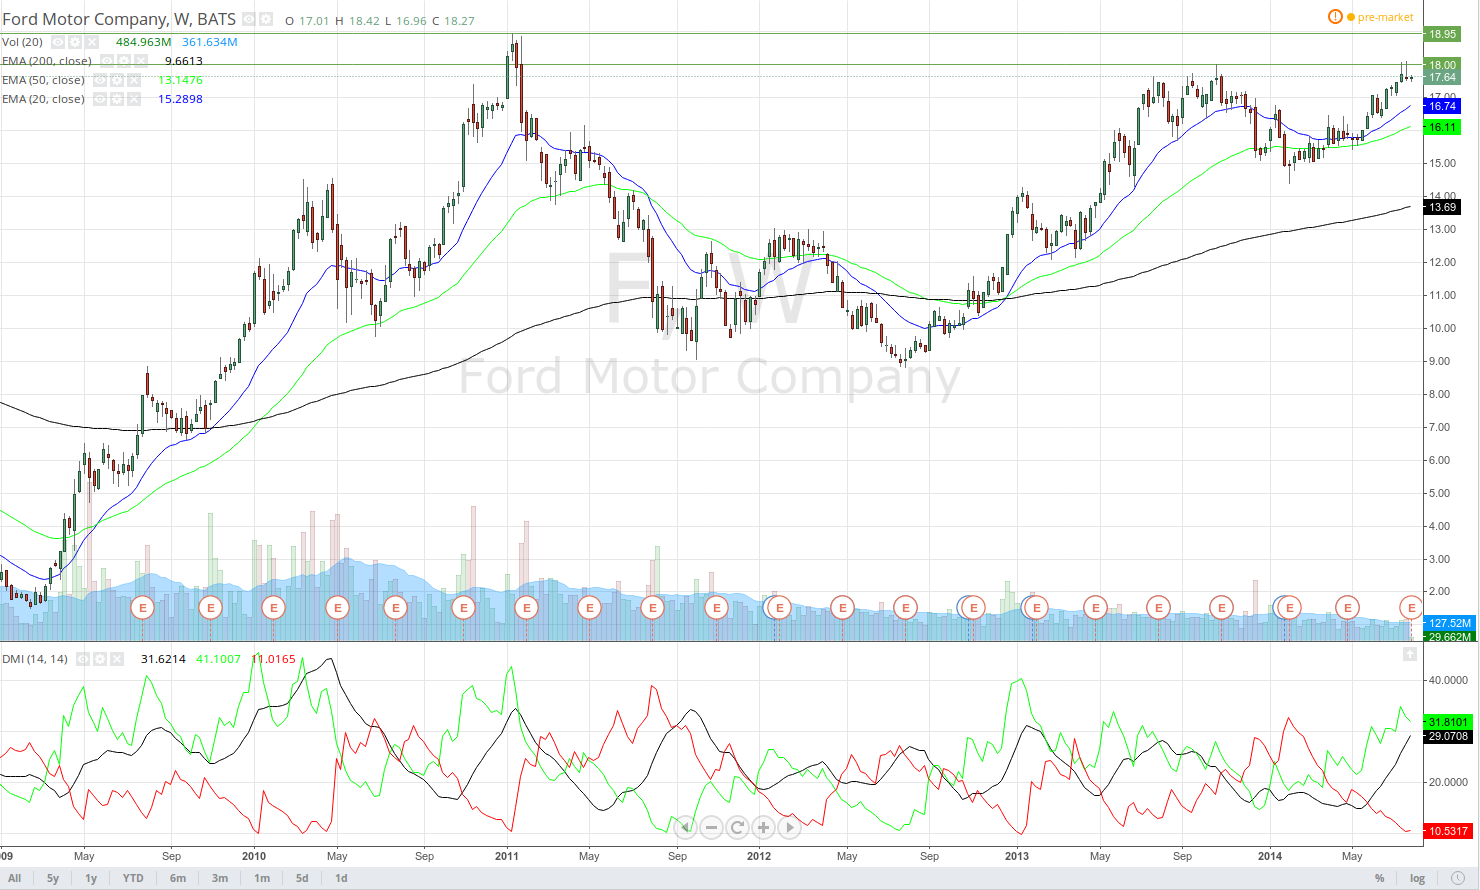
Ford Motor Company has been in a plain bull trend since February 2009, as the most prominent swing high was recorded in January 2011 ($18.97). A two-legged pullback followed and was completed in July 2012, after which the underlying trend resumed.
Confirmation was provided by the perfect order of the three Exponential Moving Averages (with their periods set to 20, 50 and 200 and the shortest one being on top) and by the Directional Movement Index (the black line on the chart), which climbed above its 20 level at the exact point, where the three EMAs crossed (the 25-day EMA crossed above the 50-day and the 200-day EMAs and the 50-day EMA also crossed above the 200-day EMA). In addition, the +DI (green line) has persistently been above the -DI (red line) since October 2012.
In October 2013 Ford made the first attempt to test the swing high from January 2011, but failed to exceed it (a Lower High at $18.02). It is evident that the price tested the October 2013 high in July 2014 and managed to break above it (a Higher High at $18.12). Therefore, we have a reason to expect that the stock is probably set to make a second attempt to test the January 2011 high, or the bull trend may continue. As a confirmation, the perfect order of the three EMAs is still valid, the +DI is above the -DI and the DMI is above its 25 level (implying considerable bull strength).
However, if Ford again fails to exceed that high, then the price will probably move in the opposite direction, because, as we know, in case the market attempts to do something twice and fails, it usually does the opposite.
Short-term movement expectations
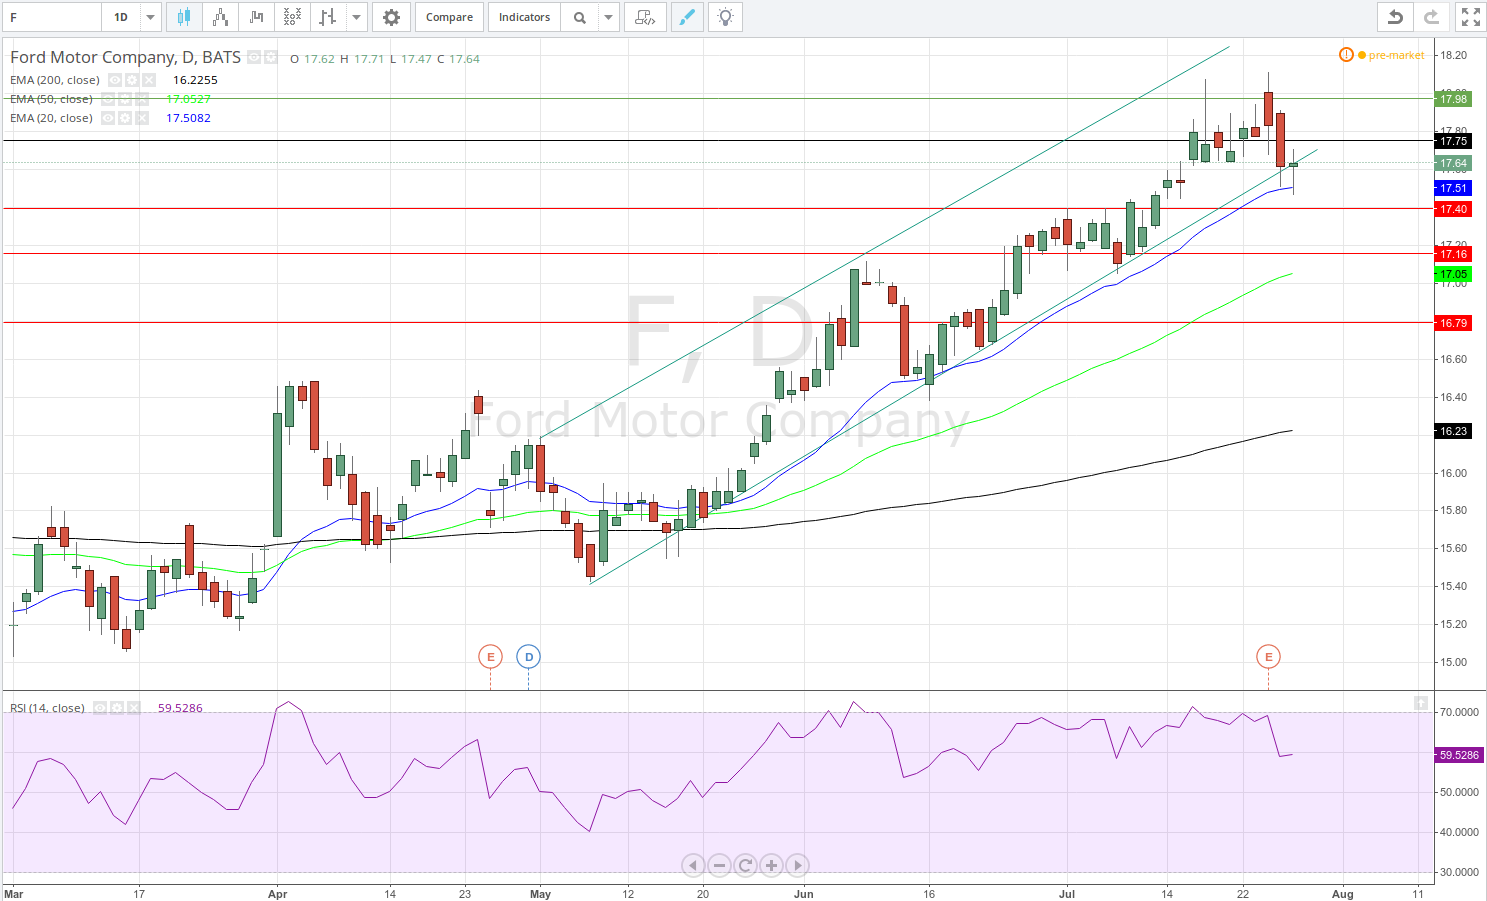
Dropping down to the daily time frame to assess short-term movement prospects, we see that the price action has been contained within an upward-sloping channel since the beginning of May. The market has respected the trend line and rebounded from it on several occasions, thus confirming its validity.
On July 28th, the charts last bar, the price managed to overshoot the trend line but the 20-day Exponential Moving Average acted as the next support level in line, sending the market back within the channel.
There are several arguements supporting the view the market might continue higher. The three EMAs order supports bullish sentiment (the 200 EMA is below the 50 EMA, which itself is below the 20 EMA and all three are clearly trending upward). Second, the trend line has definitively proven it is acting as one, and there has been no need to redraw it. Third, our oscillator of choice – Relative Strength Index, has retreated after contacting the overbought line but its retracement halted at the same level as in the first week of July, thus a possible support level within the indicator has been established.
One factor which fans bearish sentiment to some extent is that the market opened the week below the central weekly pivot point (black horizontal line), which in general sets up a bearish tone and will act as a resistance level.
However, if the price manages to breach the central pivot point and continues higher, it will encounter the Resistance 1 level at $17.98 (the green horizontal line). If the price manages to penetrate it as well, upside momentum may extend to the R2 level at $18.34 and further up to R3 at $18.56.
If, however, the market drops, initial support will be encountered at the 20-day EMA, followed by the first support pivot point (S1) at $17.40 (upper red line). In case the downmove continues, S2 and S3 will be tested at $17.16 and $16.79 respectively, as well as the 50-day EMA which will be met along the way down.