Trend reversal targets
This lesson will cover the following
- Prior failed reversals are targets for future reversals
- An example
Previous reversals, which failed, very often provide target levels for a successful reversal. In a downtrend if there have been a number of long entries, which failed as the price continued to fall, each one of these entry prices (the high price of every signal bar) will be a potential target for a successful reversal to the upside. The price may surge to the highest signal bars high, before showing a considerable pullback.
What is important to a trader is to be aware of this tendency by the market to pull back after it has tested earlier signal bars. It is very possible that some traders, who opened positions on earlier signal bars, may prefer to scale in these positions when the market moved in the opposite direction to theirs. In this case they will probably consider their initial entry as their final profit target, which will allow them to exit breakeven on their worst entry, while locking in gains on all other entries.
Many traders may find themselves holding losing positions and as they watch their losses widening, as the market moves in the opposite direction, they hope that the price will eventually return to their entries. When this really happens, they will close their positions and probably learn from the mistakes they made. Cunning price action traders may be aware of such a possibility and may use these above mentioned targets to close their long positions. In addition, very experienced traders choose to exit their positions at these target levels, because they are aware of the reliable recurring pattern for pullbacks to end in proximity to earlier entry levels. Because the market failed at these levels before, experienced traders will probably enter, supposing that the market may show another failure, which may cause the correction to end at these price levels.
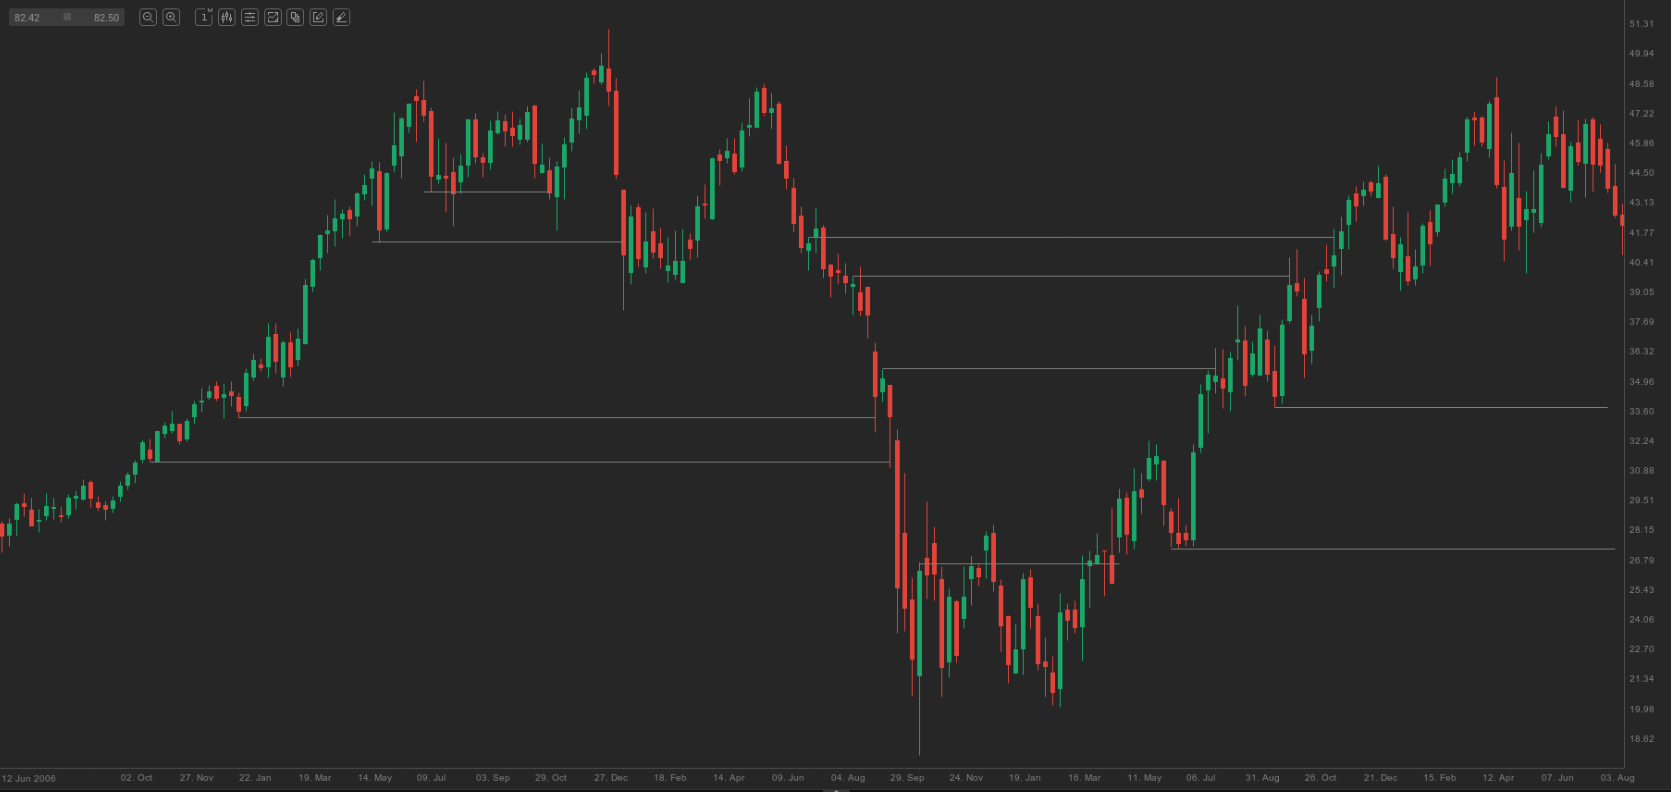
On the weekly chart of BASF above there was a strong uptrend, which ended on July 16th 2007, but several attempts for a reversal were to be seen on the way up. Each low of the bear signal bars represents a target for any retracement on the way down. Later the downtrend that ended on October 20th 2008 showed a few failed attempts for a reversal to the upside, while the high of each bull signal bar becomes a target for any correction during the following rally. The move up since March 9th 2009 showed several failed attempts for a reversal to the downside and each one of them is a target for any subsequent move down.