Gaps and pullbacks to the exponential moving average (EMA)
This lesson will cover the following
- What is a gap?
- Pullbacks to the moving average

Gaps
A gap signifies space between two points on the price chart. In case the open price of todays trading session is above the close from yesterday, a gap is formed. In case the open price today exceeds the high from yesterday, the gap will likely be visible even on a daily chart. In case the high price of a bar remains below the exponential moving average (EMA), a gap is formed between this bar and the EMA.
During an uptrend or a trading range there is a chance that the market will attempt to fill a gap above a bar, which formed below the EMA.
At times a bar is likely to exceed the high price of the previous bar, after which within 1-2 bars the pullback to the downside continues. In case the market again moves above the high price of the previous bar, an EMA Gap 2 bar forms. This is actually a second attempt by the market to fill the gap to the EMA in an uptrend, which, on the other hand, increases the chances of a rally. Such a setup provides good opportunities to enter the market.
During a downtrend or a trading range, if a gap occurs above the exponential moving average, the market will likely attempt to fill it.
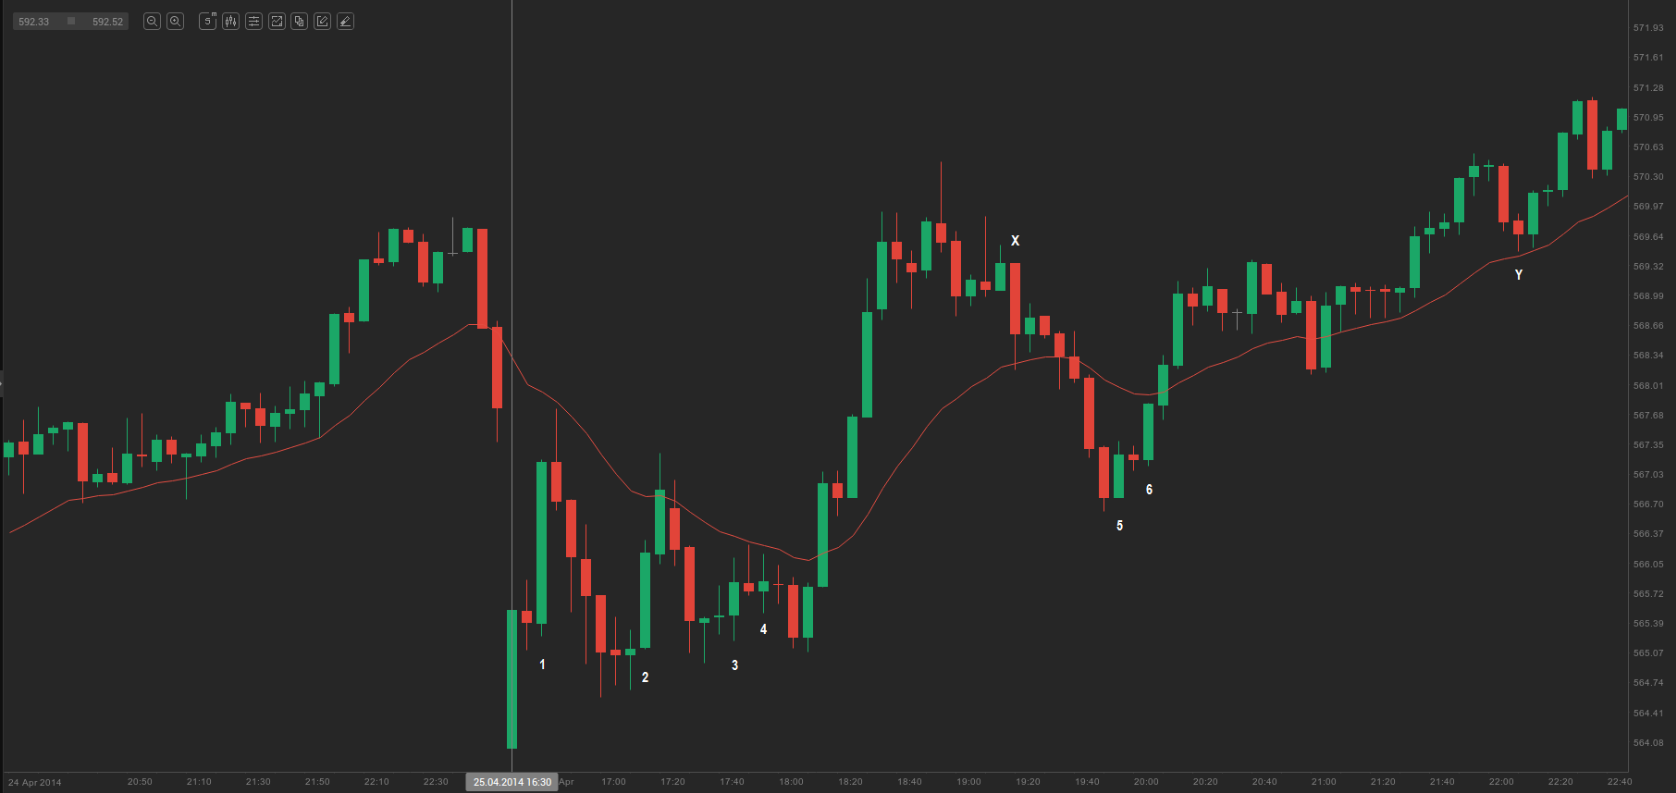
On the 5-minute chart of AAPL above bar 2, bar 4 and bar 6 were second attempts to fill the gap below the 20-day exponential moving average in a trading range. Bar X and bar Y were EMA Gap 2 Bar shorts. The price broke above bar Y and an uptrend developed, because there were already two failed attempts for a move to the downside. Bar Y was the second attempt.