Basics of trends and trend lines
This lesson will cover the following
- A basic outline of trends
- Types of trends
- Trend lines and trend channel lines
- Trend channels
As weve already said in previous articles, there are two states a market can be in – it is either trending, or trading sideways. A beginner trader should be very cautious when playing in ranging markets, because they carry a much higher risk of loss and experienced market players are very good at reading those and trapping the newbies. Weve mentioned several times that novice traders should stick to trending markets and enter with-trend positions, because going against the market could be very destructive for your account, if you lack the experience needed.
So, let us begin with some basics regarding trends. A trend defines a direction in market prices. When we refer to a trend, we mean a directional trend (formed by rising or declining prices), from which a trader can generate a profit, if he has the required skills. A chart can show us only one or two major trends, due to their length, but there are also smaller versions of a trend – swings, pullbacks and legs.
Insert link below
Weve mentioned in the article “Price Action From Trading Ranges to Strong Trends” that markets rarely exhibit simple straightforward behavior, and if they do, it’s just for a short amount of time. Prices tend to switch from trending to ranging behavior and you will rarely see them acting in only one of those two ways for an extended period of time.
In addition, as trends have different lengths, shorter-term trends are parts of longer-term trends. For a technical analyst, a trend is a directional movement of prices, which remains valid long enough so that it could be identified and still be playable. A trend should be identified as early as possible and be long enough so that a technical analyst can profit from it.
Types of trends
 A rising trend (uptrend) is formed, when prices reach higher peaks and higher troughs. A decreasing trend (downtrend) is formed, when prices reach lower peaks and lower troughs.
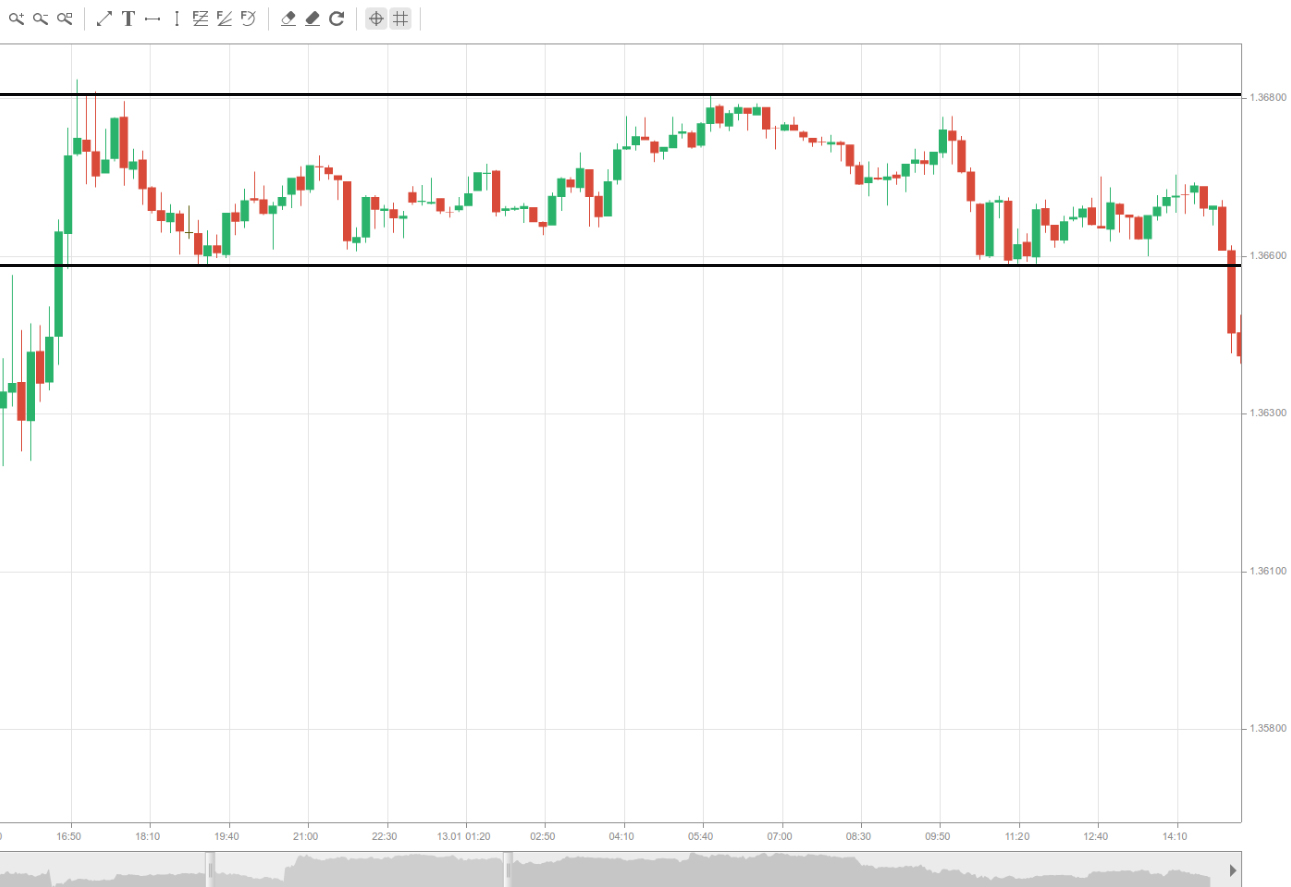
A sideways trend (flat trend) occurs, when prices tend to trade in a specific range without demonstrating a significant upward or downward movement, they move up and down, but remain at approximately the same level. This configuration occurs after a larger trend has reached a temporary halt. A flat trend is also called a consolidation or congestion area. You can see one on the following screenshot.
A trend is visualized by drawing trend lines. Trend lines can be based on linear regression or in a easier way, by connecting at least three extreme points (peaks or troughs). By drawing trend lines, the trader gets an idea of the price movement and its limits, which, if broken, can signal the trend may reverse or flatten out to sideways trading.
Trend channel lines
 The other type of lines used in trend visualization are the so-called trend channel lines. They are also straight and diagonal lines, containing the price action, but they are on the opposite side of the trend lines.
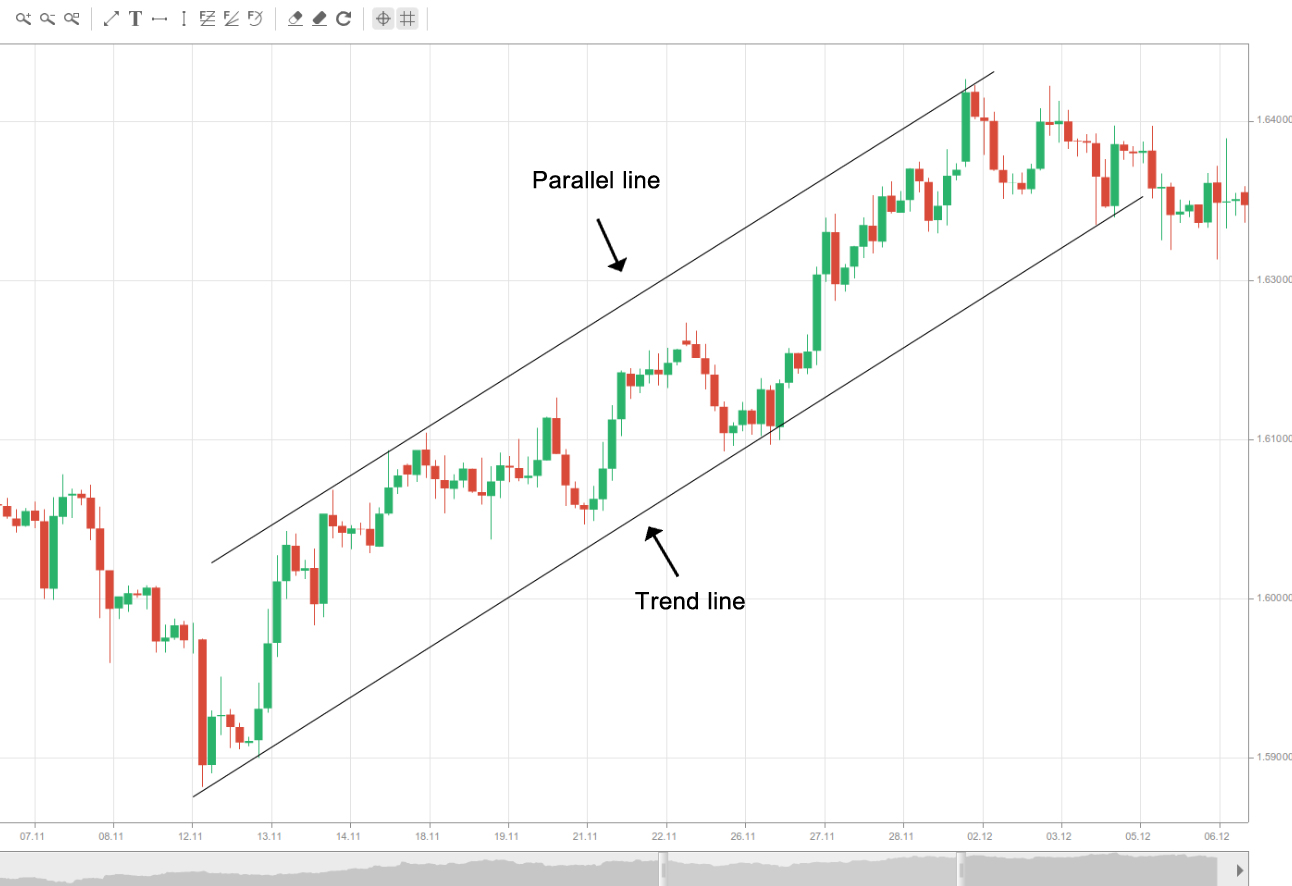
For example, in a bullish trend the trend line is plotted below the price action, while the trend channel line is positioned above the highs of the market movement. Respectively, in a bearish trend the trend line is above, while the trend channel line is below the price action.
The slope of the trend line and trend channel line may vary from being parallel, to being convergent, thus, forming descending triangles, and divergent, thus, forming ascending triangles. Parallel lines form trend channels, which just as the trend itself can be ascending, descending or ranging. In the example below you can see a rising channel.
In general, trend lines are used as entry points for with-trend positions, because they play the role of a support in a bullish trend and resistance in a bearish trend. Conversely, trend channel lines most often generate counter-trend entry points, since they act as a resistance in uptrends and support in downtrends.
One thing of crucial importance you need to remember is that market movement tends to build up inertia, making the markets more likely to continue doing what they have been doing, instead of shifting directions. This is why more often trend reversals and trading range breakout attempts fail, instead of being successful.