Improve your binary options trading style by learning and implementing the moving averages strategy. Weve already talked about chart patterns and what their significance to technical analysis is. However, its really important to clear out that in most cases things arent as clear as in the examples weve presented. In many cases there are lots of price fluctuations and different movements, making it notoriously difficult for an analyst to deduce the correct trend of an asset every single time.
One of the most interesting methods traders use to mitigate the effects of this phenomenon is to apply moving averages. Moving average is just a fancy way of saying that they calculate the average price of the asset for a predetermined period of time. This way they are able to observe the data more clearly, thus identifying genuine trends and increasing the probability of things working out well for them in the end.
Types of Moving Averages
 There are many types of moving averages, but three of them are the most popular, commonly known and most widely used. These three types are simple, linear and exponential. There may be differences in the way the average is calculated, but the interpretations remain the same. Most of the variables come from the fact that there is different emphasis put on different data points. In some cases more emphasis is placed on recent movements, while in other instances the price fluctuations of the whole period of equal importance.
Simple Moving Average (SMA)
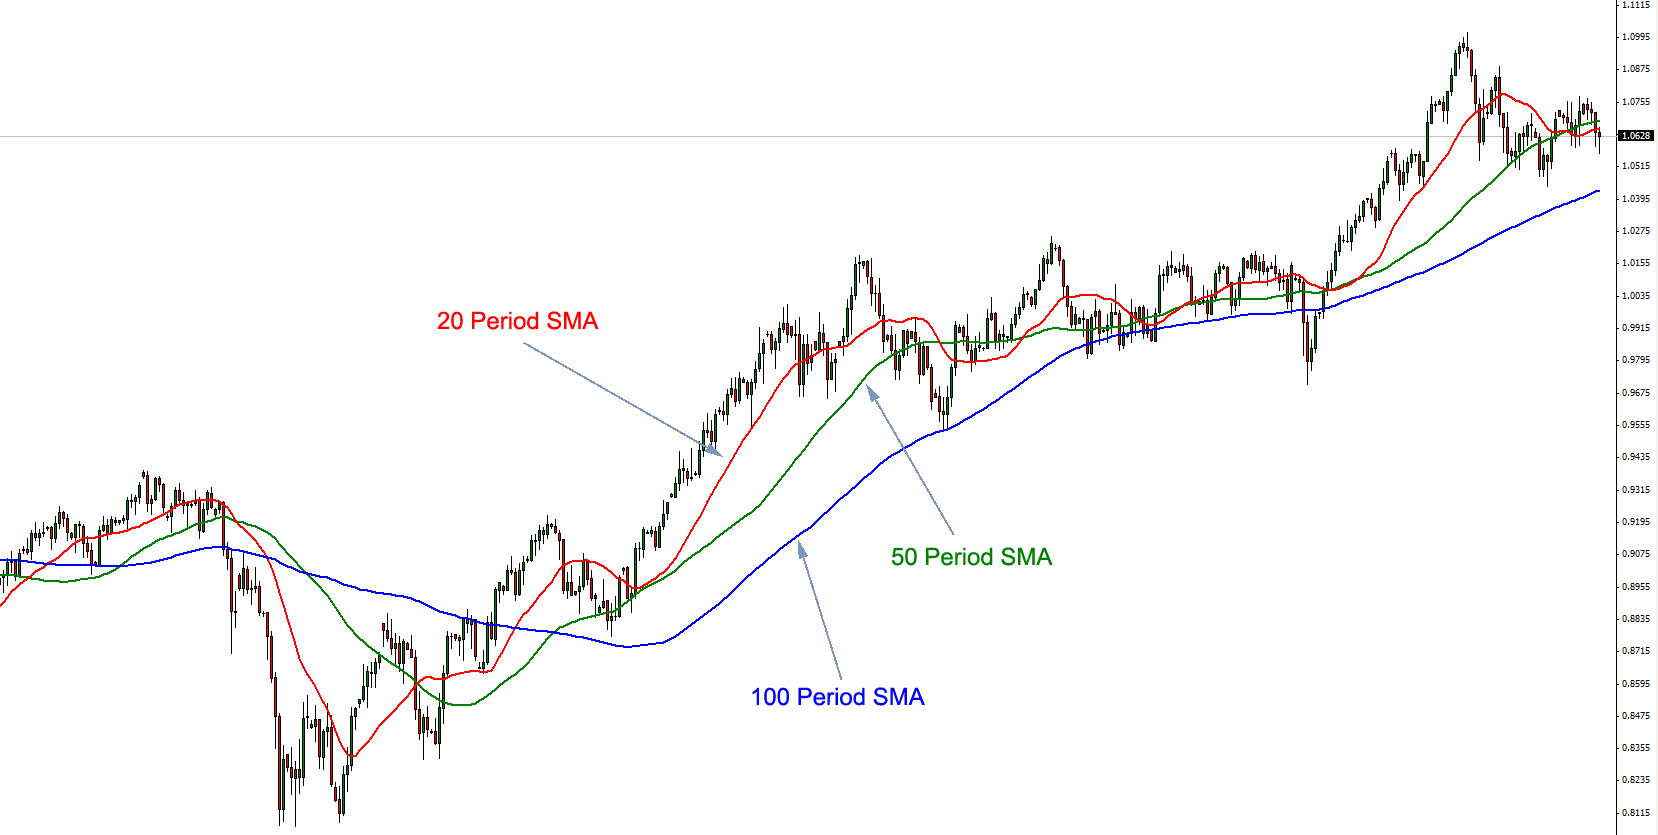
 As the name suggests, the simple moving average (SMA) is one of the simplest methods to calculate the moving average. As such, it is also very popular and commonly used by many traders and analysts. The method is as simple as they get – in order to calculate a moving average using this method, one needs to take the sum of all the closing prices of the certain period and then divide it by the number of prices taken. To make this more clear, heres an example. Lets say we want to calculate the moving average for a 10-day period. In this case, we take the closing price of all 10 days, sum them together and divide them by 10. This way the strength of the trends can be measured and become more apparent. With all the illusions removed, the trader can make sound choices concerning his finances and not be worried about the outcome. Look at the example below and everything will make sense.
A large number of analysts and traders speculate that the data presented by the SMA is not detailed and relevant enough to be taken seriously. For them, recent price movements are much more essential and they believe that this aspect of the price movement should be given the proper attention and weight. Since simple moving average takes everything into consideration with the same importance, its easy to see why this argument would be held. Certainly, for many traders, recent movements are much more important and if that is not reflected in the average, they feel the average, itself, is not accurate enough. This is what lead to the creation of other methods of calculating the averages.
Linear Weighted Average (LWA)
 Some experts strongly believe that the SMA isnt adequate enough to serve their needs, which is why they look elsewhere for reassurance. Where SMA is lacking in respect of relevance for these traders, linear weighted average more than makes up for. The problem is solved by adding more emphasis on more recent data. This is done by introducing more complicated calculations. Instead of simply taking the closing prices, exerts instead take the closing prices for a period of time, then multiply the closing price based on its place in the chronological progression.
For example, if we have a three day linear weighted average, then every day would be a data point, in which case we take the different closing prices and multiply them by the place of the data point. The first days closing price will then be multiplied by one, the second by two and the third by three. Then all the values are summed up and divided by the sum of multipliers (in this case it would be 3+2+1=6), essentially giving us the average with more emphasis on the third day than the first. Of course, if we were to choose a longer time window, the rules would apply all the same and it would not matter how many days weve picked. This is the basis of the principle.
Exponential Moving Averages (EMA)
 Like LWA, EMA strives to put more emphasis on the more recent prices in the time frame. However, it does so in a bit more complicated and perhaps more refined manner, unlike the rudimentary nature of the LWA. To many the exponential moving average is much more efficient and preferred. In most cases you dont even have to know how the different calculations are performed because the data is laid down for you in most charting packages, meaning that you wont have to compute the averages, yourself. Everything you require is laid down before you and all you need to do is make sense of it (which can sometimes be a bit harder than it looks).
As a more advanced technique, EMA is used much more frequently used than LWA. Even though it has its critics, SMA is still very popular, leaving the LWA as the most rarely used of the trio. EMA is much more sensitive to new information than the SMA is. This is one of the reasons why it is preferred to the much simpler alternatives – because it delivers satisfactory enough information to many of the traders who employ technical analysis. If you take a look at the same chart from two different perspectives – that of the SMA and that of EMA, you will notice that as the different values rise and fall, the EMA corrects itself much faster than its simpler counterpart. The differences may be subtle, but they can be important enough to influence decisions in different ways.
Major Uses of Moving Averages
 As weve already said before, moving averages are used to dispel any illusions and deceptive factors in the data. This means that their primary objective is to assist technical analysts and traders to more easily identify trends and make decisions based on a more general data. Sometimes the information in the short-term can lead us to believe that the market conditions are different form what they actually are and moving averages help us to deal with possible misconceptions. They also help us to set up the levels of support and resistance, which are important as well, if you remember.
Its easy to identify a trend based on the direction of a moving average. If a moving average is going up and the price is above it, then we are talking about a definite uptrend. If, however, the moving average is going down and the price movements are below it, we can clearly see a downtrend.
Another way we can determine a movement in a trend is to have a look at the relationship between two moving averages. If we have a long-term average below a short-term one, then we are talking about an uptrend. If the short-term average is below the long-term average, then we are witnessing a downtrend.
Moving averages can also help us spot trend reversals. There are two main signals for a trend reversal, both of them characterized as crossovers. The first one is when we have a crossover between the moving average and the price. If that should happen, then we are possibly talking about a trend reversal. This is just a signal, of course, which means that this isnt the case 100% of the time. However, the signal is strong enough and accurate in enough cases as to require caution. If there is indeed a change in the trend, it will be reflected in the moving average shortly.
The other signal is the crossover between two moving averages. If we see this, then we can almost always be sure that there will be a trend reversal. If the moving averages are both short-term, then we might be talking about short-term trend reversal. Logically, enough, if we see a crossover between two long-term moving averages, then this definitely speaks of long-term trend reversal.
Just as crossovers are used to signal a trend reversal, moving averages can be used as a tool to determine the support or resistance levels. Long-term moving averages are especially useful in this respect. There many cases when the price of a security would go down until it reaches the moving average, and then go back up. In this case, the moving average serves as a level of support. We know that the price will probably not break it and if it does, this signals of a trend so we will be prepared and will know what to do based on the current status of market.
Moving averages are very useful for technical analysts and help them clear out the “noise” and irrelevant (or less relevant) data they dont really want to pay attention to. They can help predict or confirm trends and give us a nice overview of the situation on the market.