Using Moving Averages in conjunction with the ATR
You will learn about the following concepts
- Measuring the stop
- Trade Management
Measuring the stop
 Our strategy will use a stop-loss determined on the base of volatility. There are different volatility indicators but we will use one of the most popular – Average True Range with a default trackback of 14 periods. It shows what the average daily range over the last 14 periods was, e.g. ATR with a value of 0.00125 means that the average daily range for the past 14 periods was 125 pips. If you want to learn more about this indicator, check out our article “Average True Range”
However, because currency pairs have different volatility, we cant use the same protective stop for each one. For more volatile crosses, with an ATR of 100 for example, a stop-loss order placed 40 pips away from the entry might be fine, but for a currency pair with an ATR of 50 that will be too wide.
Therefore, we will use our knowledge about ATR and come up with a better stop-loss system. Our protective stop will be placed at a distance of 50% of ATR from the EMA, on the opposite side. The idea is that, because the EMA is a support/resistance area, you would wait for it to first play its role as such, and if it fails, you will then rely on your stop-loss to cut your losses. Therefore, in a bull trend, our stop-loss will be placed at 50% of ATR below the EMA, while in a bear trend – above the EMA.
Because we know that the entry point will be at the EMA, as soon as we have our stop-loss figured out, we can proceed with the trade. If all the previously laid conditions are met (strong trend confirmed by proper positioning of the EMAs and 10-period EMA acting as support/resistance for at least 10 bars), we enter as soon as the price pulls back to the EMA and touches it, without waiting for the bar to actually close.
Next, we calculate 50% of ATR and project it beyond the opposite side of the EMA, which is where our stop loss will be. This might seem too wide in some situations, but keep in mind that this strategy aims to exploit strong trends, which on our larger time frames might extend for days and weeks, thus, the profit potential is huge. If the trade goes in our favored direction, i.e. the market rises in consonance with our long position, we will trail our stop up. As soon as a bar closes, we will calculate ATR and the 10-period EMAs latest value and move our stop accordingly.
In case the trade goes against our expectations, we should never move our stop lower (or higher for a short position), so that our capital exposure is fixed to the predetermined amount. If all goes according to the plan and we continuously trail the stop higher as the EMA rises, at a certain point it will surpass the breakeven point, thus, ensuring that our trade will be profitable.
Because our position might remain open for a protracted period of time, especially on a daily time frame, the profit potential is huge, hundreds of pips (the bull trend in the second example had a range of 300 pips). At the same time, our maximum capital exposure is the distance to the initial stop-loss, which makes up a risk-reward ratio of 1:3 and possibly much more. Another advantage of this trading system is the fact that it requires very little maintenance. Once you have entered the trade and set your stop-loss, all you need to do is trail your stop until it is hit. The frequency depends on the time frame you are using. Because you will be adjusting it according to changes in the EMA and ATR, and because they change when a bar closes, you will need to adjust your stop-loss once every hour on an hourly chart, or once per day on a daily chart – its all up to you. If you are using the daily chart, then this trade will not be time consuming at all, but it can still yield a lot of pips for your pocket.
Example
 Let us look at an example and follow up the whole trend from the beginning to its end. Let us look at the same example, which was provided in the previous article.
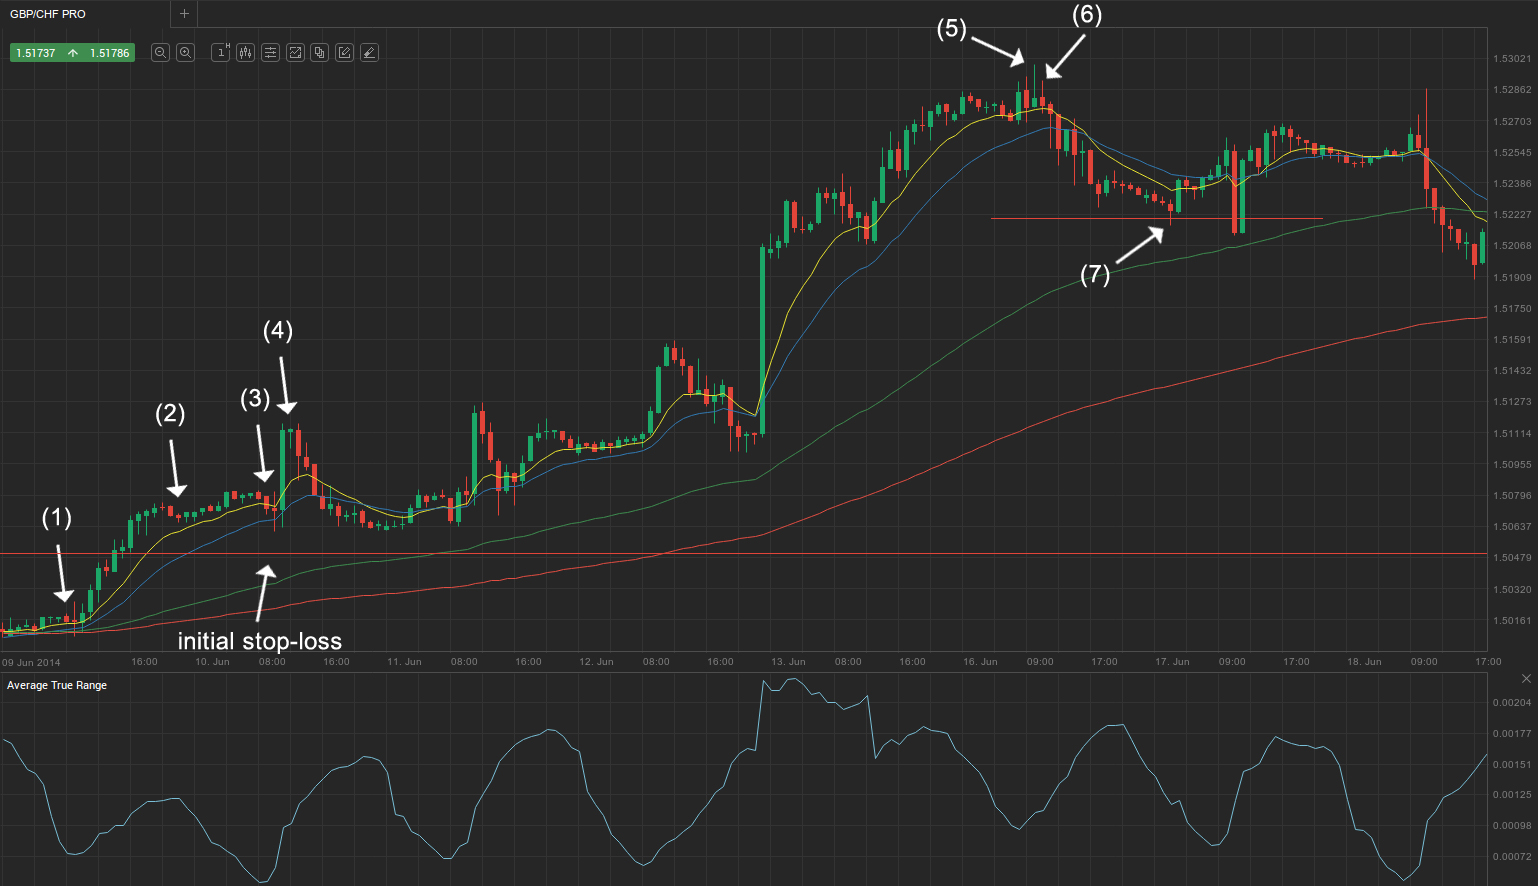
The market was previously in a trading range, as evident by the slow EMAs being flat (89 EMA is in green and the 200 EMA is in red). However, by bar (1) the faster EMAs (10 EMA is in yellow and 20 EMA in blue) crossed the slower ones from below and edged higher. As we know, moving average crossovers, especially when it comes to crossing a 200-period one, provide very strong entry signals.
After the crossover, the four EMAs positioned themselves according to our strategys criteria and the only thing left to do was to have the 10-period EMA act as a support zone for at least 10 bars. As you can see from the screenshot, it played that role before the crossover, but for our example we will begin counting those 10 bars after the crossover. If we follow the rule to enter at the first possible dip, we must go long at bar (3). However, another possible entry would be at bar (2) because it was a minor pullback in a what seems to be the start of a strong trend, although the price did not touch the EMA.
For our example we will stick close to the rules and enter at bar (3), which is at 1.5075. At that point the ATR has a value of 0.00051, thus, our stop (50% of ATR) should be placed at 26 pips below the EMA, or at 1.5049.
During the next one hour the price dipped and penetrated both the 10 and 20-period EMAs but remained well above our protective stop. Over the next couple of bars, the market performed a strong rally that pushed the 10-period EMA up, which calls for an adjustment of our stop. As soon as the big bull trend bar (4) closed, we recalculate and trail our stop. The EMA was at 1.5871, while the Average True Range was at 0.00091. Therefore, we need to widen the stop. Having done the math, we move our stop-loss up to 46 pips below the EMA, or to 1.5825 pips.
We need to trail our stop higher on the same principle after the next two bars. The following pullback below the 10 and 20-period EMAs was only a minor one and reached 1.5062 at its lowest level, remaining far away from our protective stop. The market was then on the rise again and we needed to adjust our trailing stop after each period when the 10-period EMA rose.
The strong bull trend continued for seven days and reached its extreme level at bar (5) at 1.5299. This was 224 pips above our entry point. However, every good trend is bound to come to an end. Our last stop-loss adjustment was after the close of bar (6). The 10-period EMA was at 1.5277, while ATR was at 0.00111. So, we placed our stop-loss 56 pips below the moving average, i.e at 1.5221. The following down-move triggered our stop at bar (7) and our position was closed with a profit of 146 pips, scoring a risk-reward ratio of around 1:3 relative to the widest stop level. Keep in mind that this is for sure not the strongest trend we have seen and it is only on an hourly chart. There is a lot of potential for even greater profits.
Trade management
 In the course of trading we might employ additional techniques to boost our performance and secure gains, in case we doubt our success. We can use the scaling out technique. As we know, scaling out allows you to lock in some of your profit earlier, while leaving the other portion of your position in the market to profit more, if the market continues to move in the desired direction. This yields smaller potential return in comparison to milking out the trend with the entire position, but also carries a smaller risk.
In case you want to reduce the risk, you can scale out from your trade by exiting a portion of your position (less than a half at best) when the price hits or undershoots the trend channel line. The remainder of your position (half at minimum) should be held and managed according to our initial strategy – by trailing the stop below the EMA in conjunction with the ATR. This can be a viable trading strategy, because we know that trend channel lines are strong resistance zones in uptrends and strong support areas in downtrends, thus, a retracement often follows. However, you should not scale out of the trade too early and it is advisable to aim for a risk-reward ratio of at least 1:2 before you decide to take partial profits. As we said, the remainder should be held until the price triggers your protective stop.
Because this strategy is used in strong protracted trends, it will often provide us with possibilities to re-enter the market after we have scaled out. Therefore, if we have closed a part of our position, but we believe that the trend will go on for an extended period of time, we can expand our position to its original size at a pullback.