Combining the Relative Strength Index and Bollinger Bands
You will learn about the following concepts
- Indicators used with this strategy
- Signals to be looking for
- Entry point
- Stop-loss
- Profit target
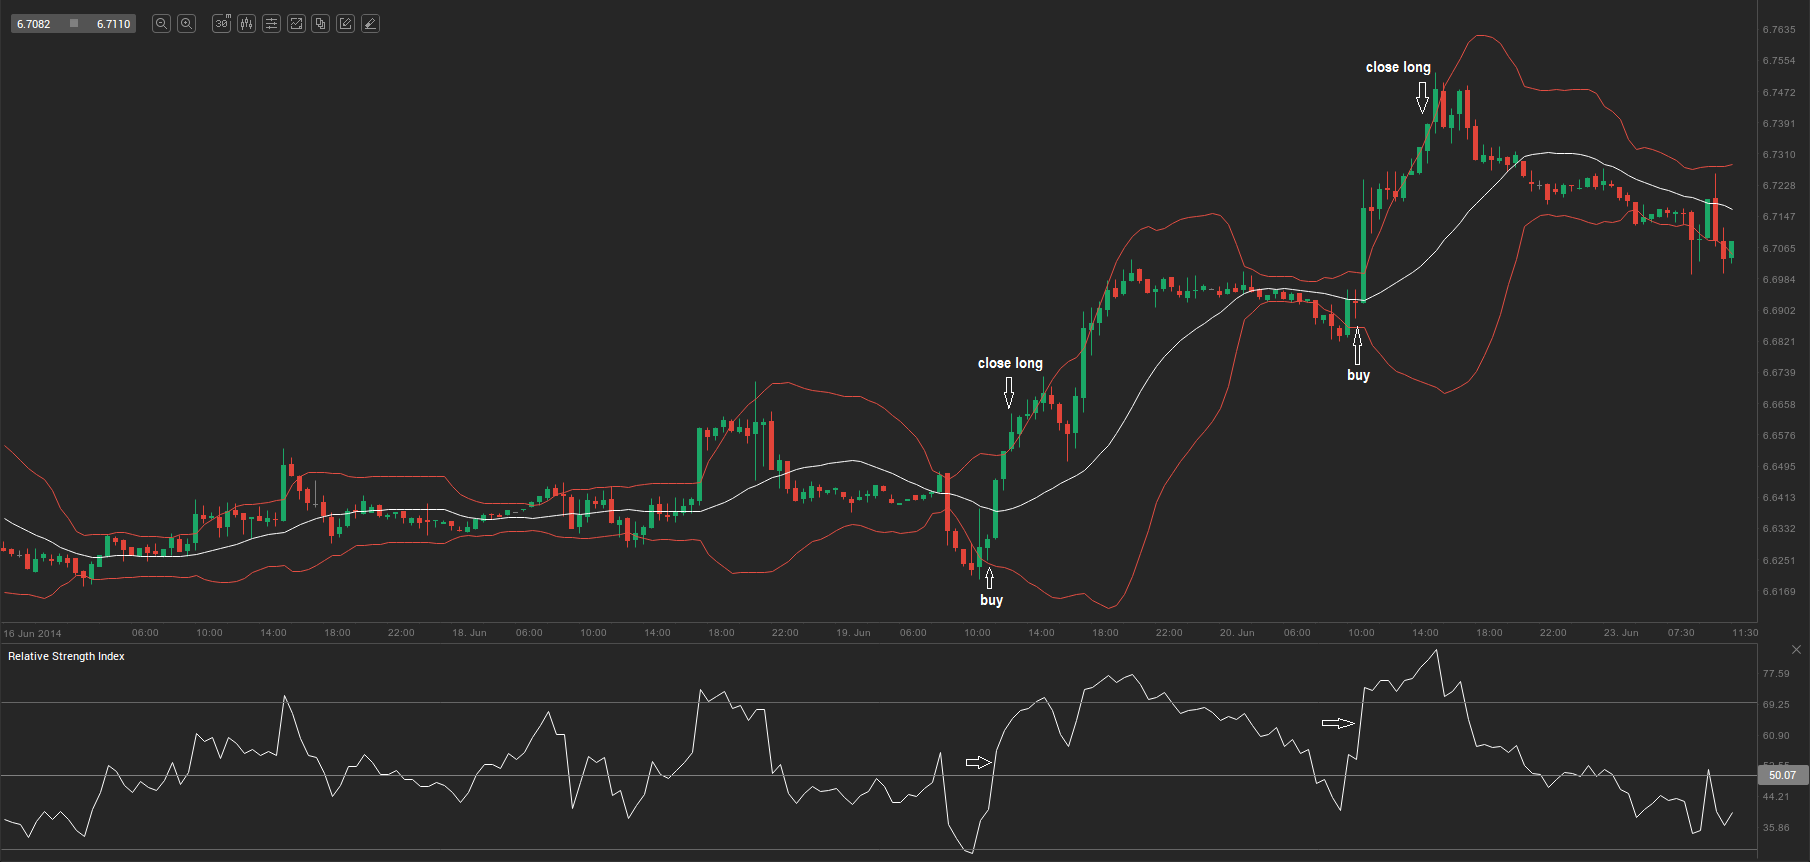
For this strategy we will be examining the 4-hour and 30-minute time frames of USD/SEK chart. The indicator we will be using is the Relative Strength Index (RSI) (with its period set to 14, overbought level – 70, oversold level – 30), while we will also apply the Bollinger Band (with its default settings). We mark the 50.00 level of the RSI and use it in order to determine whether the market is trending up or down. On the 4-hour chart of USD/SEK, if the RSI reading is above 50.00, then the market is in an uptrend and a reading below 50.00 indicates a downtrend. In order to make an entry, a trader will need to use the 30-minute time frame.
During a bull trend in case a candle closes below the lower band of the Bollinger and then the next candle closes above the lower band, this is a setup for a long entry. The protective stop needs to be placed on the low price of the candle, that closed below the lower band.
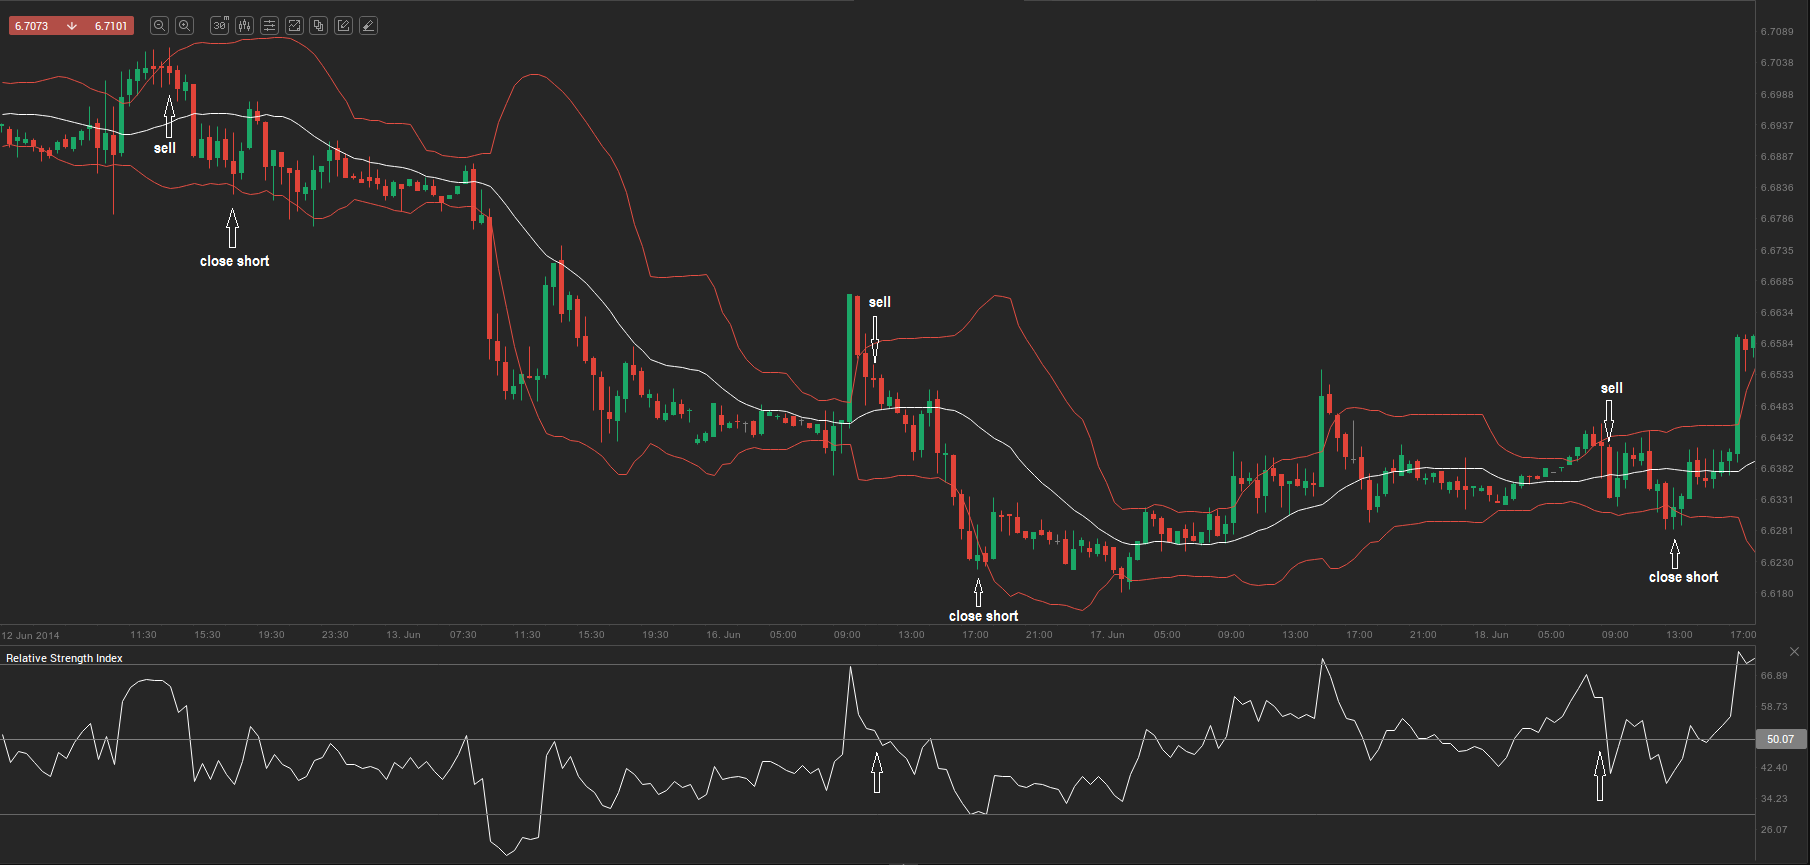
During a bear trend in case a candle closes above the upper band of the Bollinger and then the next candle closes below the upper band, this is a setup for a short entry. The protective stop needs to be placed on the high price of the candle, that closed above the upper band.
Below we visualized several short and long trades, based on the above mentioned trading approach.