Ultimate Oscillator
This lesson will cover the following
- Explanation and calculation
- How to interpret this indicator
- Trading signals, generated by the indicator
Developed by Larry Williams in 1976 and introduced in Stocks & Commodities Magazine in 1985, the Ultimate Oscillator attempts to capture momentum across three different time periods, aimed at avoiding drawbacks of other oscillators. Many of the momentum-based oscillators increase at the start of a strong move up, after which they create bearish divergence, as the price surge continues, because they follow a single time frame only.
The time frames used for the Ultimate Oscillator are as follows: short-term (7 periods), medium-term (14-periods) and long-term (28 periods). These time frames overlap each other, or the long-term time frame encloses both the medium-term and the short-term time frames.
The Ultimate Oscillator (UO) is calculated using the following steps:
First, calculating Buying Pressure in order to identify price action direction,
Second, measuring Buying Pressure in relation to the True Range in order to determine the magnitude of a profit or a loss,
Third, calculating averages using the three time frames we mentioned above,
Fourth, calculating a weighted average, based on the three averages (the oscillator itself).
The calculations are as follows:
1. Buying Pressure = Close – Minimum (Low Price or Previous Close),
2. True Range = Maximum (High Price or Previous Close) – Minimum (Low Price or Previous Close),
3. Average (7-period) = (7-period Buying Pressure Sum) / (7-period True Range Sum)
Average (14-period) = (14-period Buying Pressure Sum) / (14-period True Range Sum)
Average (28-period) = (28-period Buying Pressure Sum) / (28-period True Range Sum)
4. UO = 100 x [(4 x Average7) + (2 x Average14) + Average28] / (4+2+1)
Buying Pressure and its relation to the True Range are the core of the UO. According to Williams, the best way to estimate Buying Pressure is just to subtract the Closing Price from the Low Price or the Previous Closing Price, the lowest of the two. The UO usually surges, when Buying Pressure is strong and declines, when Buying Pressure is weak.
According to the criteria, defined by Larry Williams, a signal to buy is generated when:
1. A Bullish Divergence is created between prices and the Ultimate Oscillator. This is a situation, when the market forms lower lows, while the oscillator forms higher lows.
2. During the divergence the UO has dropped below the level of 30. This is required in order to make sure that prices are oversold.
3. The UO has climbed above the high, formed during the Bullish Divergence.
A long position should be closed, when the oscillator climbs above the 70 level, or climbs above 50 and then drops back below 45.
A signal to sell is generated when:
1. A Bearish Divergence is created between prices and the Ultimate Oscillator. This is a situation, when the market forms higher highs, while the indicator forms lower highs.
2. During the divergence the UO has climbed above the level of 70. This is required in order to make sure that prices are overbought.
3. The UO has dropped below the low, formed during the Bearish Divergence.
A short position should be closed, when the oscillator drops below the 30 level, or surges again above 55 after falling below 50.
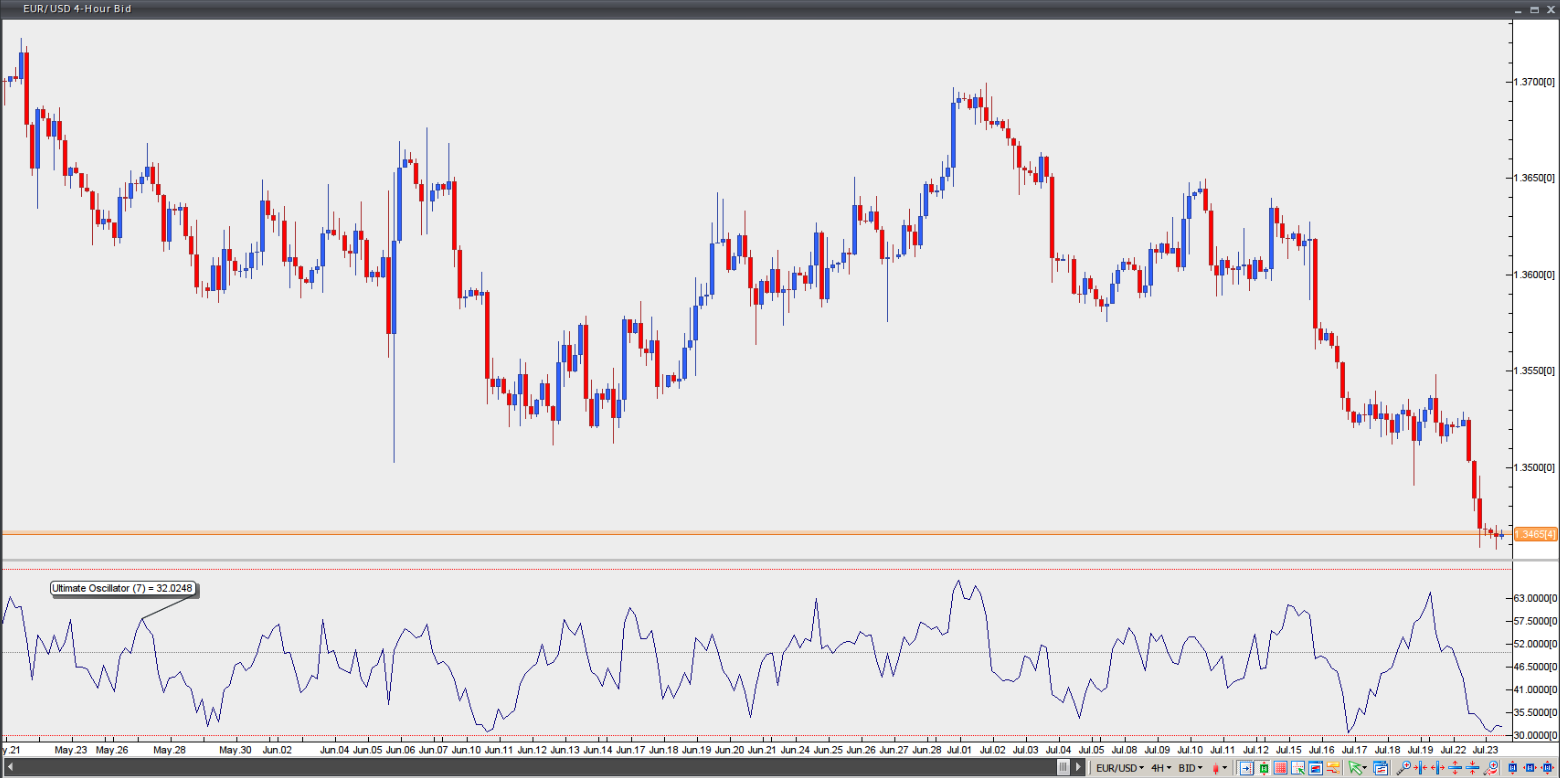
Chart Source: VT Trader