Ulcer Index
This lesson will cover the following
- Definition
- Calculation
- Interpretation
Developed by Peter Martin and Byron McCann, the Ulcer Index is a technical tool that, unlike the standard deviation indicator which takes into account all volatility, measures only downside risk, based on the assumption that upside volatility is in your favor. Thus, it estimates how risky trading a certain asset is in terms of both depth and duration of the price declines. Because the Ulcer Index focuses only on downside risk, it is considered by many traders as superior to other risk-gauging indicators which measure two-way volatility.
The Ulcer Index is calculated through the following three calculations. Default settings commonly use a trackback span of 14 periods.
– Percentage Drawdown = [(Close – 14-period Maximum Close) / 14-period Maximum Close] x 100
– Squared Average = (14-period Sum of Percentage Drawdown Squared) / 14
– Ulcer Index = Square Root of Squared Average
Basically, the Ulcer Index measures the decline from the most recent high during the given trackback period. Thus, the further the price retreats from that high, the larger the Ulcer Index will grow in value. Conversely, the closer the price is to the most recent high, the lower the Ulcer Indexs value will be. The index will hit zero if prices close higher with each bar. On the screenshot below you can see the index visualized in a trading platform.
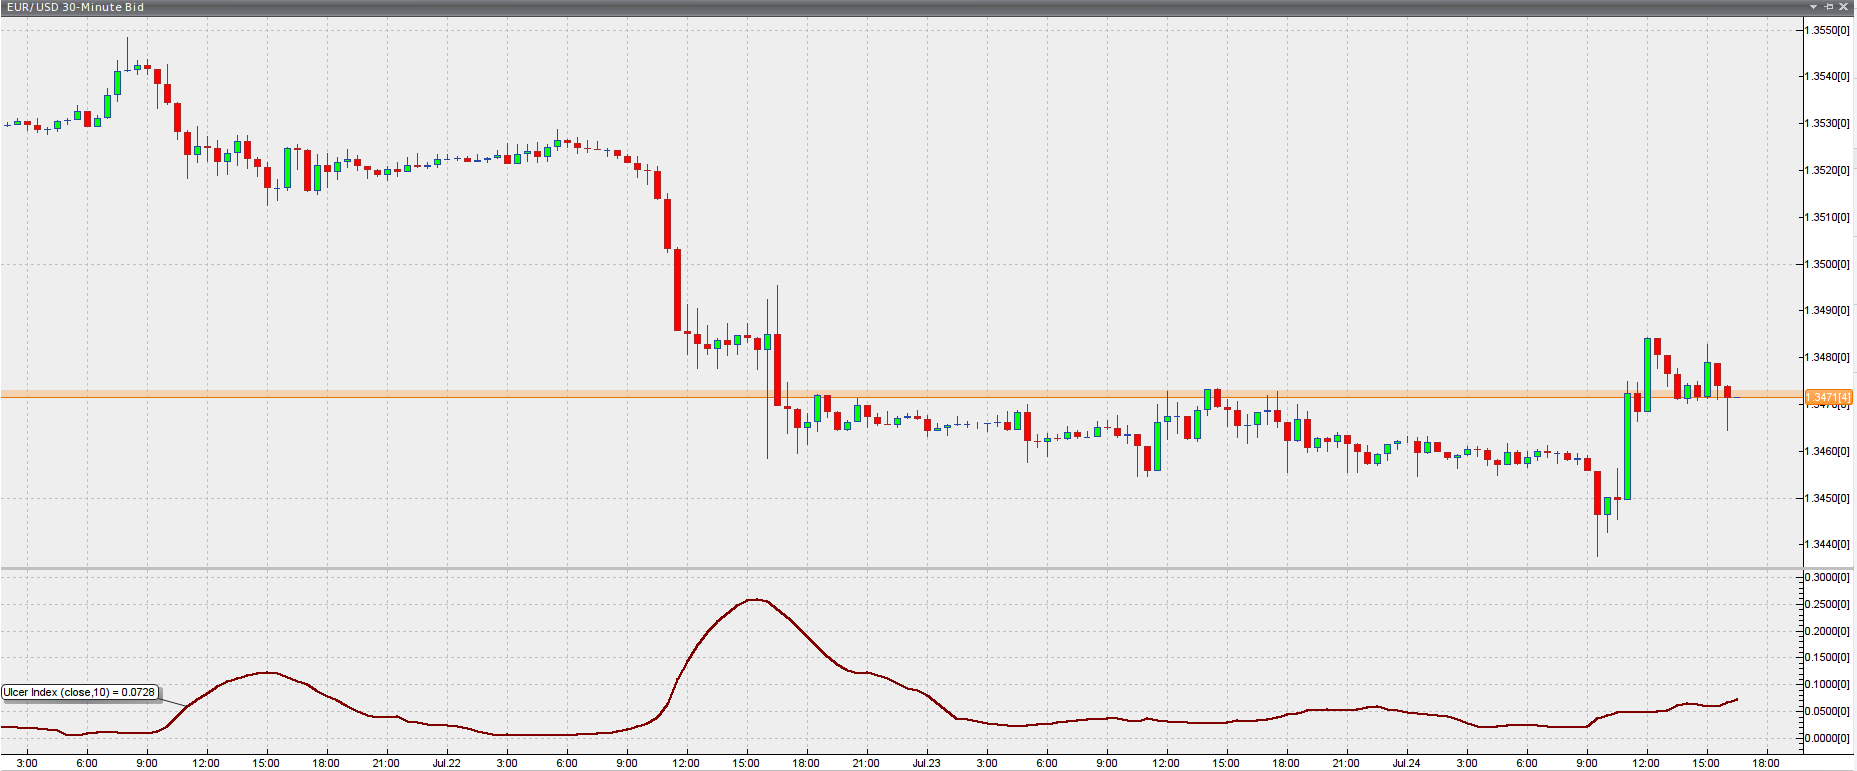
Chart source: VT Trader
Because the index bases its calculations on the most recent high within the lookback period chosen by the trader, we can enlarge the trackback span to attain a better view on the markets downside risk levels. Conversely, lowering the number of periods being tracked will shift our focus toward assessing the most recent volatility.
Spikes in the indexs value that exceed the “normal” level, typically above 7.5-10 on the scale, suggest exorbitant downside risk. Thus, the Ulcer Indexs usefulness lies in its ability to compare different investment options by the relative risk they carry, especially if you apply a moving average to its values.
Its interpretation was defined by Peter Martin himself: “Ulcer Index measures the depth and duration of percentage drawdowns in price from earlier highs. The greater a drawdown in value, and the longer it takes to recover to earlier highs, the higher the UI. Technically, it is the square root of the mean of the squared percentage drawdowns in value. The squaring effect penalizes large drawdowns proportionately more than small drawdowns.”