This lesson will cover the following
- Explanation and calculation
- How to interpret this indicator
- Trading signals, generated by the indicator
This lesson will cover the following
- Explanation and calculation
- How to interpret this indicator
- Trading signals, generated by the indicator
Developed by William Blau and described in Stocks & Commodities Magazine, the True Strength Index (TSI) is a momentum-based oscillator, which incorporates the leading characteristic of a differing momentum calculation with the lagging characteristic of an averaging function. This creates an indicator, which captures the flow of price action and filters out the noise.
The TSI is calculated in three stages: double smoothed price change, double smoothed absolute price change and the final TSI.
The double smoothing method includes the following steps:
First, calculating the change in price from a given period to another,
Second, calculating a 25-period Exponential Moving Average, based on the price change,
Third, calculating a 13-period Exponential Moving Average, based on the 25-period EMA.
Double Smoothed Price Change:
1. Price Change = Current Price Level less Previous Price Level
2. First Smoothing = 25-period EMA, based on Price Change
3. Second Smoothing = 13-period EMA, based on 25-period EMA
Double Smoothed Absolute Price Change:
1. Absolute Price Change = Absolute Value of Current Price less Absolute Value of Previous Price
2. First Smoothing = 25-period EMA, based on Absolute Price Change
3. Second Smoothing = 13-period EMA, based on 25-period EMA
True Strength Index formula:
TSI = (Double Smoothed Price Change / Double Smoothed Absolute Price Change) x 100
The TSI oscillates between positive and negative territory. If the TSI is positive, this implies bullish momentum. If the TSI is negative, this implies bearish momentum. There are several ways to use the TSI as a signal provider:
First, crossing the zero line. A signal to buy is generated, when the TSI crosses above 0. A signal to sell is generated, when the TSI crosses below 0.
Second, crossovers between the TSI line and the signal line. The signal line represents an Exponential Moving Average of the TSI line. A signal to buy is generated, when the TSI line crosses above the signal line. A signal to sell is generated, when the TSI line crosses below the signal line.
In order to reduce whipsaws, a trader may prefer to increase the settings for the TSI or the settings for the chart.
Third, taking advantage of overbought and oversold conditions. An overbought condition occurs, when the TSI is at or above its +25 level. An oversold condition occurs, when the TSI is at or below its -25 level. Signals are generated when the TSI crosses these extremes. In case the TSI crosses below -25 and then moves back above it, a signal to buy is generated. In case the TSI crosses above +25 and then moves back below it, a signal to sell is generated.
A trader will be provided with faster signals and less lag, if he/she prefers to use shorter periods for the TSI. However, this increases the probability of whipsaws and unreliable signals.
The trader will get less whipsaws, if he/she prefers to use longer periods for the TSI. However, signals will be lagged and the the risk-to-reward ratio will be lower.
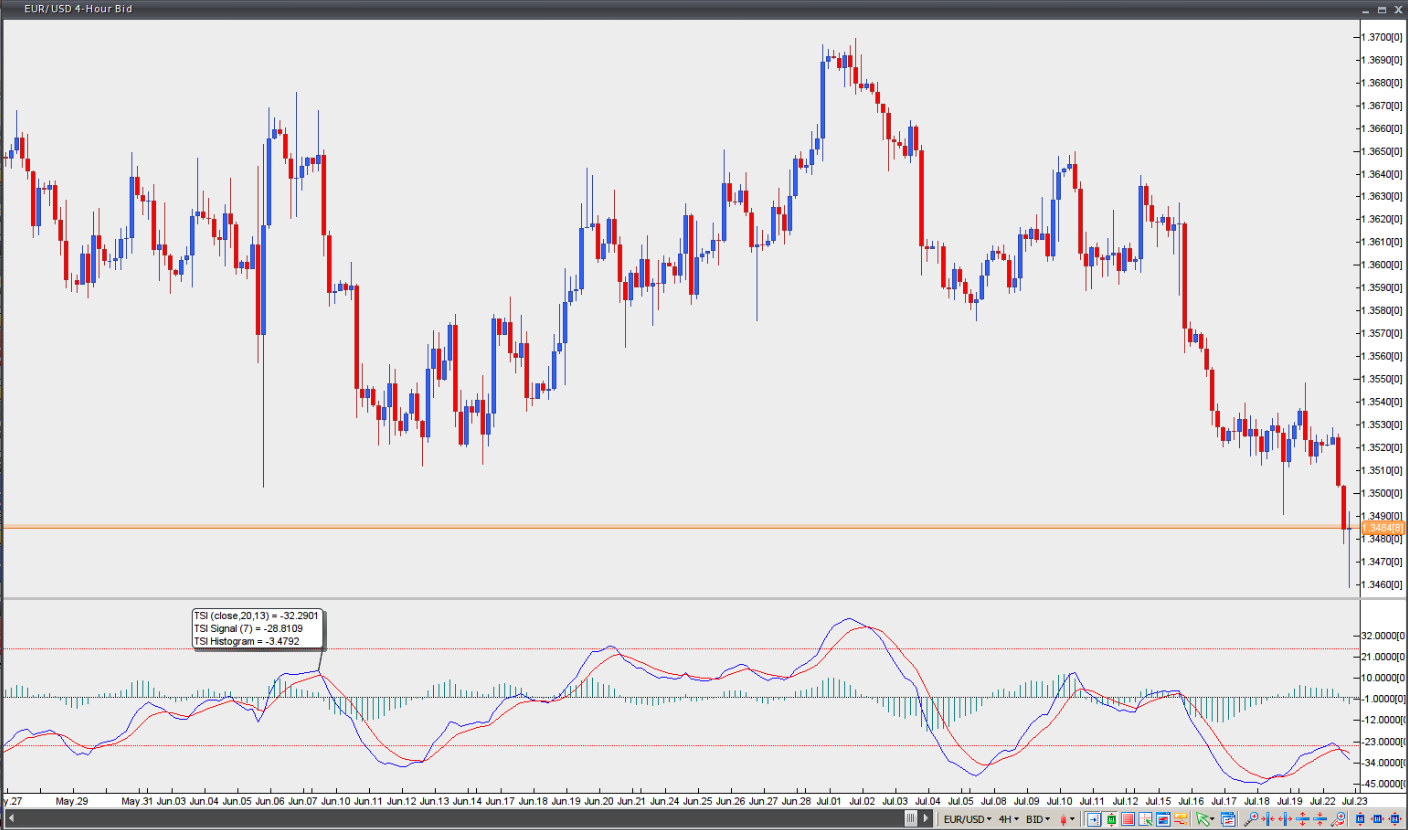
Chart Source: VT Trader