TRIX Indicator
This lesson will cover the following
- Definition
- Calculation
- Interpretation
Developed by Jack Hutson, TRIX (or triple exponential moving average) is a momentum indicator very similar to MACD, designed to filter out movements in price action that are insignificant to the larger trend. It basically displays the rate of change of a triple exponentially-smoothed moving average, from which it derives its smoothness and filter characteristics. The trader selects a certain trackback period to create the moving average and the oscillator then filters out cycles that are shorter compared to that period.
TRIX has two main advantages over other trend-following indicators. The first is that it superior in filtering market noise and second, it tends to act as a leading indicator, instead of a lagging one, because it measures the difference between each bars smoothed price version.
Due to the similarities between the signals generated by TRIX and MACD, it is traded in largely the same manner. In fact, the main difference between the two is that the TRIX is much smoother. We will speak about trading TRIX once we have explained the calculation and plotting method.
Calculation and plotting
 The TRIX indicator is the 1-period percentage rate-of-change of a triple smoothed Exponential Moving Average. A triple-smoothed EMA is basically an EMA of an EMA of an EMA. Say we choose an 18-period lookback span. The calculations will look as follows:
TRIX = 1-period percentage change of the triple-smoothed EMA
Single-smoothed EMA = 18-period EMA calculated based on the prices close
Double-smoothed EMA = 18-period EMA of the single-smoothed EMA
Triple-smoothed EMA = 18-period EMA of the double-smoothed EMA
Thus, TRIX will be positive while the triple-smoothed EMA is moving higher and will gain negative value as soon as the triple-smoothed EMA reverses down. However, the triple smoothing ensures that the number of reversals will be minimized.
The TRIX indicator can be used both as a momentum indicator and as an oscillator. When used as a momentum gauge, positive values indicate that momentum is gaining, while negative readings imply a decline in momentum.
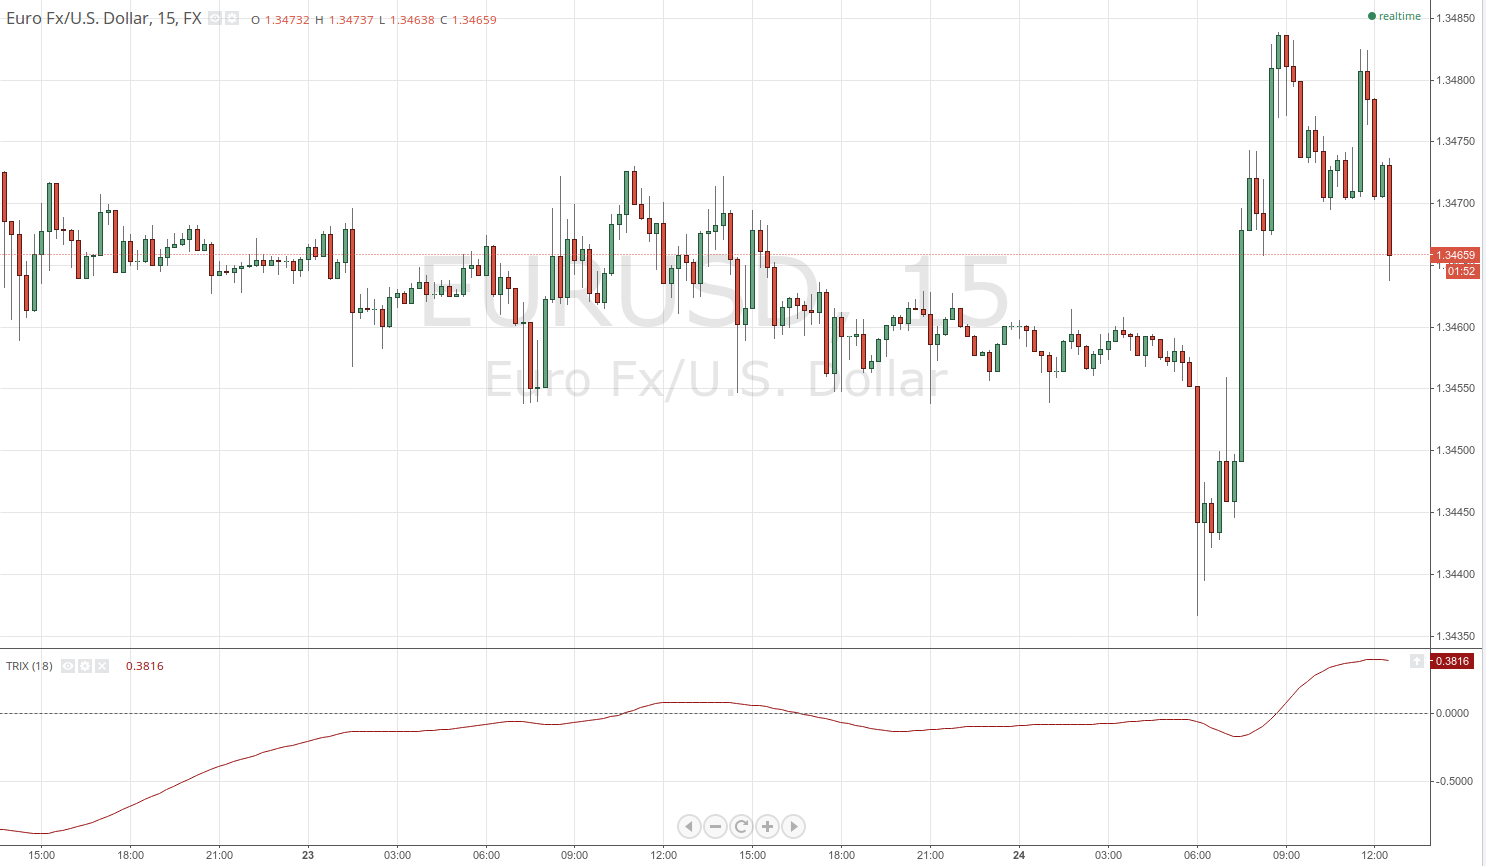
When used as an oscillator, fluctuations in its values determine whether the market is overbought or oversold, pinpointing possible reversal, or at least retracement levels. Below you can see the indicator visualized in a trading platform.
Trading TRIX
 As we said, TRIX and MACD are very similar momentum oscillators and logically are traded in an analogous manner. You can trade crossovers of the 0-level threshold and you can also trade divergences between the price and the indicator.
Alternatively, and very often, an additional signal line can be added to the indicators scale to produce crossovers which follow the same logic as MACD. The signal line is a moving average of the TRIX indicator. Thus, when the TRIX line crosses the signal line from below and continues higher, the crossover produces a bullish entry signal, and vice versa.
As for the 0-crossover level, the logic is simple and mirrors MACD. When TRIX turns positive, i.e. crosses the zero line from below, it implies that a bull trend is beginning and triggers a long entry signal. Conversely, when it drops below the threshold, it generates a short signal.
Another possible way to trade this indicator is to use a combination of two moving averages with different lengths – for example an 18-period TRIX and a 30-period TRIX. This works in a similar way as the signal line crossover – when the faster TRIX reverses and goes beyond the slower TRIX, it indicates a shift in price action momentum.