Trend Trigger Factor
This lesson will cover the following
- Definition
- Calculation
- Interpretation
Designed by M.H. Pee, the Trend Trigger Factors role is to help traders detect uptrends and downtrends and thus allow them to better position themselves in a with-trend manner. Its creator argues that the markets are mostly random but have a small trend component, which is the most crucial part of trading success. Being able to determine whether the market is in a bull or bear trend and how strong that trend is will allow you to be on the right side of the market for longer, capitalizing as much as possible on its trending behavior.
In his article, M.H. Pee used a 15-period trackback span to explain the calculations. The TTF formula is based on the so-called Buy Power and Sell Power. In his example, Pee labeled today as day 1, yesterday as day 2, the preceding day as day 3 and so on. Thus, the formulae are as follows:
– 15-day Buy Power = (Highest high of day 1 through day 15) – (Lowest low of day 16 through day 30)
– 15-day Sell Power = (Highest high of day 16 through day 30) – (Lowest low of day 1 through day 15)
Having estimated the two variables, we then move on to the TTF calculation itself:
– 15-day Trend Trigger Factor = [(Buy Power – Sell Power) / (0.5 x (Buy Power + Sell Power))] x 100
Thus, the denominator of the TTF is actually the average range of the two 15-day periods (day 1 through day 15 and day 16 through day 30).
The Trend Trigger Factor is similar in interpretation to the Relative Strength Index. It is plotted on a scale with most prominent levels at +100 and -100, crosses of which logically signal possible trade entries. The indicator allows the trader to be in the market during most of the time. The following screenshot shows how the TTF is visualized in a trading software.
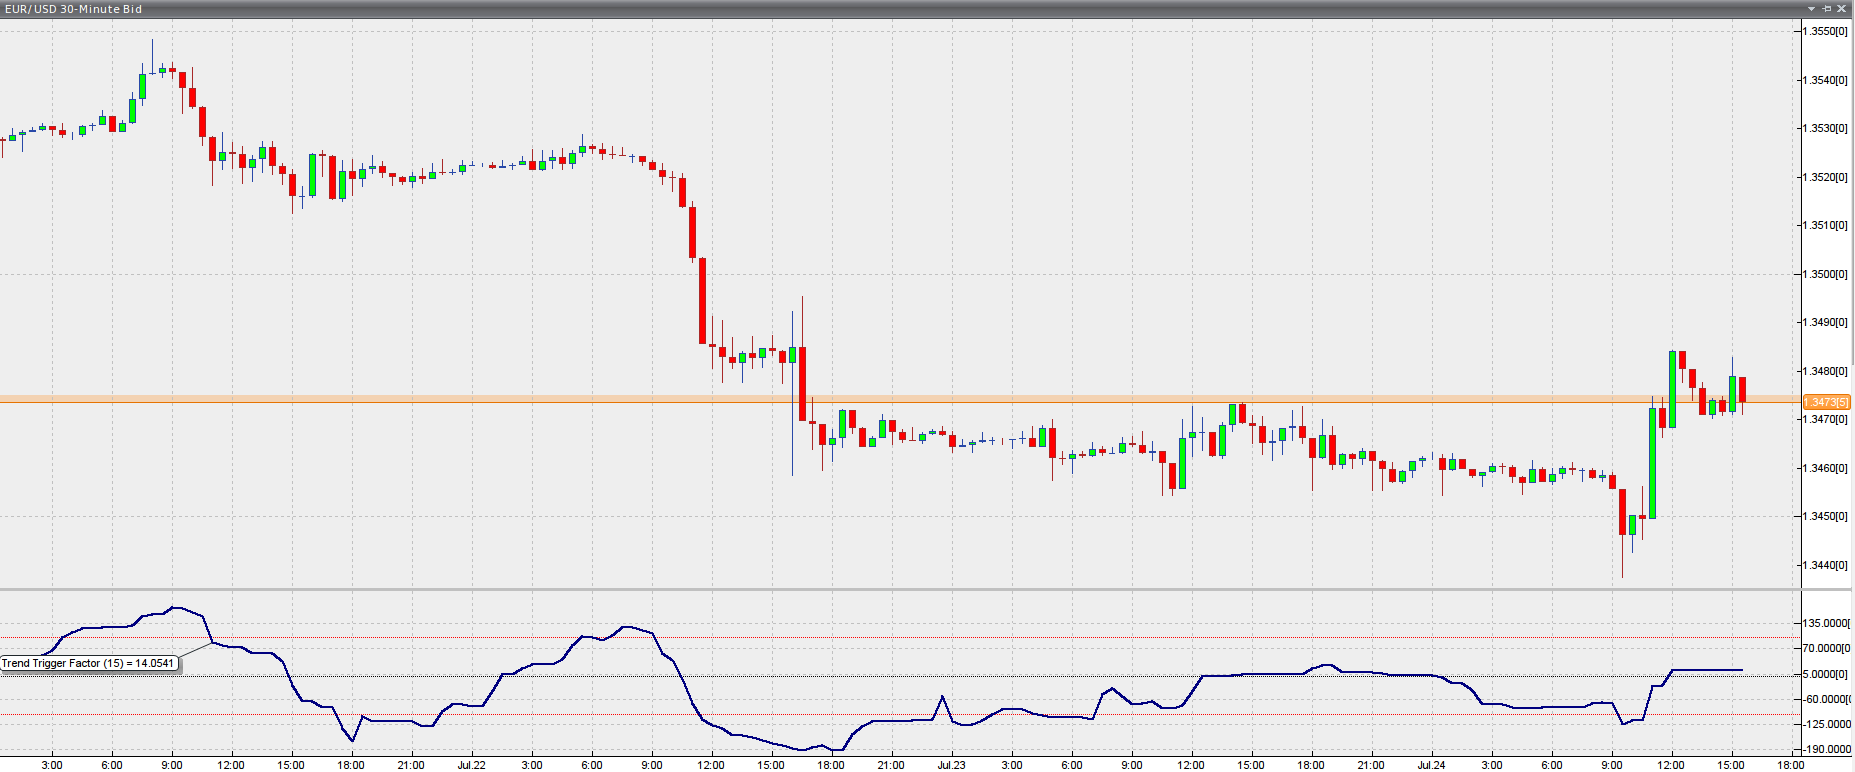
Chart source: VT Trader
A conventional trading strategy, suggested by the TTFs creator itself, is to always be on the long side when the indicator has a value of above +100 (which indicates a bull trend is in motion). In case you were short and the TTF jumped above +100, you should reverse your positioning. If the indicators value is below -100, reflecting a bear trend, you should focus on entering only short. In case you have opened a position and the TTF holds between +100 and -100, you should keep your current position.
In addition, when the TTF performs a reversal move you should again shift your positioning. Thus, this addition to the strategy makes it an always-in-the-market system.
For example, say you were long, but then the indicator dropped to below -100, implying you should reverse to short positioning. As soon as the TTF reverses back and rises above that level, you should go long. Conversely, a short entry signal will be produced when the indicator is above +100 but reverses below that level.