Stoller Average Range Channels
This lesson will cover the following
- Definition
- Calculation
- Interpretation
as we sai
Developed by Manning Stoller, the Stoller Average Range Channels are an indicator designed to encompass most of the price action, just like every other banding indicator, and thus pinpoint higher-probability entry points when the price crosses through any of its boundaries. The channel expands and contracts in accordance to changes in the Average True Range, the indicators measure of volatility.
The so-called STARC Bands are plotted around a simple moving average of the underlying assets price, thus the SMA is its core. Each boundarys position is then calculated by adding or subtracting the value of the ATR to/from the SMA. Here are the formulas:
Upper STARC band = SMA + ATR
Lower STARC band = SMA – ATR
Keep in mind, however, that before the calculation is executed, ATR is multiplied by a user-specific multiplier factor, which is most often 2. Commonly, the Simple Moving Average tracks back six periods. Thus, generally the more comprehensive formula (dont forget the variables are situational) looks as follows:
Upper STARC band = 6-period SMA + ATR*2
Lower STARC band = 6-period SMA – ATR*2
Here is what the indicator looks like when plotted in a trading platform.
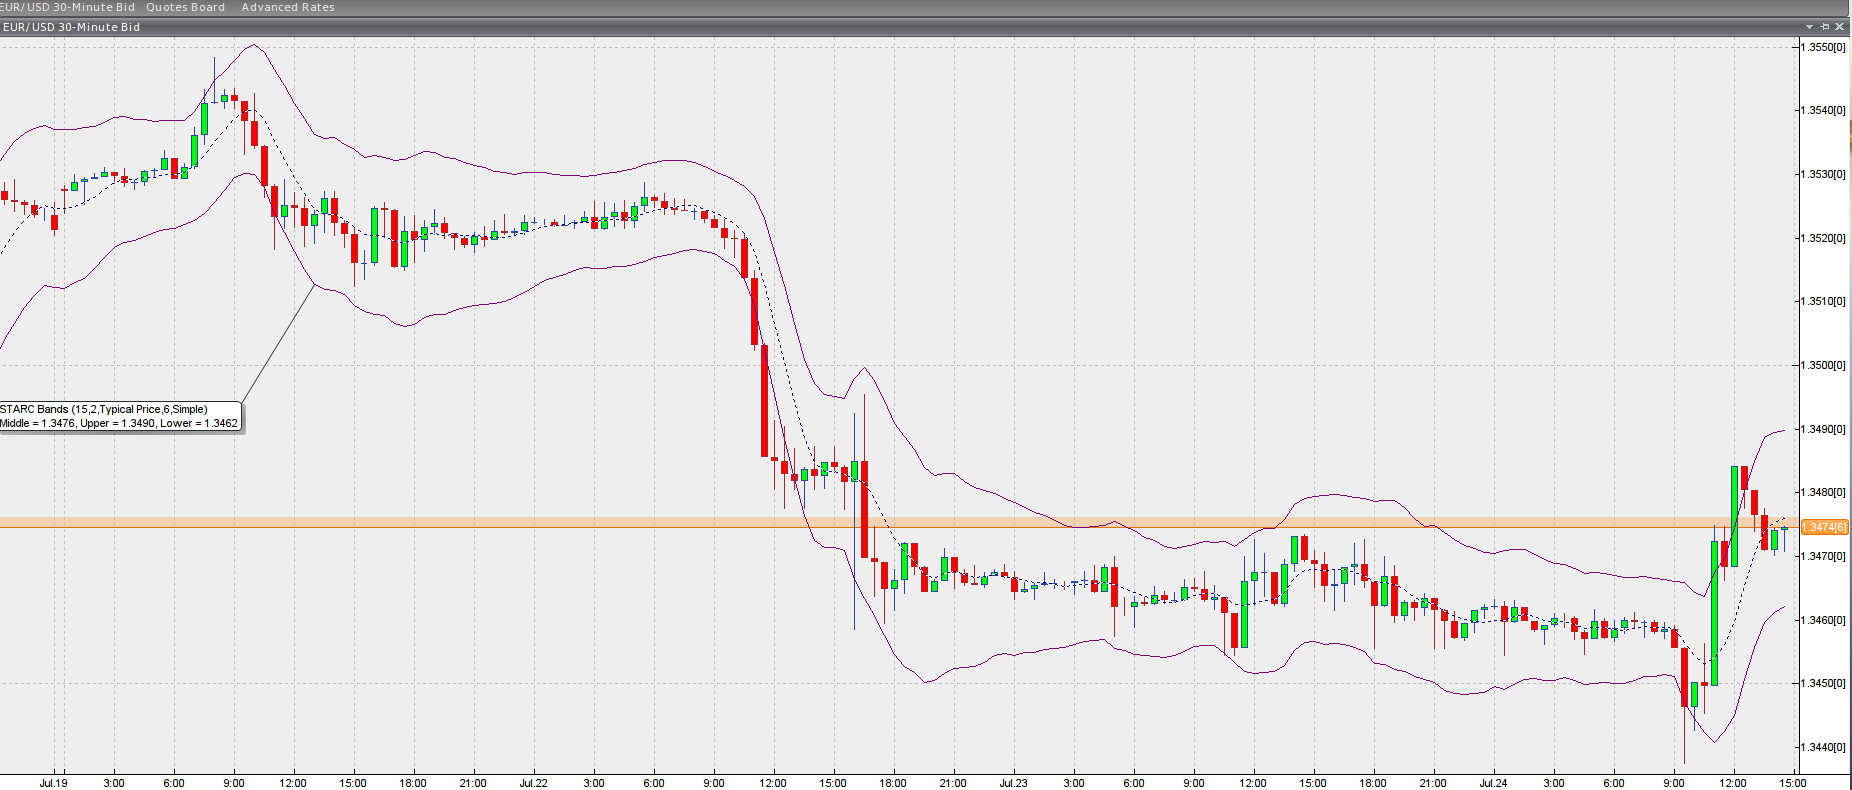
Chart source: VT Trader
Interpretation and trading
 As we said, just like any other banding indicator, the STARC Bands are developed to encompass most of the price action, thus setting boundaries for the “normal” price fluctuations. As a result, any moves that spike out of the STARC channel are considered either as excessive, or as a sign that the current trend is gaining strength (depends on whether the market is moving sideways or trending). Thus, there are two ways for a boundary break to be interpreted, which in both cases call for a low-risk high-probability trade.
 If the the market is range-bound, then breaks outside of the STARC channel are generally expected to stall and eventually retrace back to the Simple Moving Average. For example, if the price is declining and breaks through the lower boundary, while the market is generally trading sideways, a sound assumption would be that the market will soon reverse and head back toward the SMA (and very often even touch the opposite band). However, no pattern is fool-proof and it would be best to wait for a confirmation from a reversal bar pattern. If confirmed, then the scenario at hand provides a low-risk buying opportunity and a high-risk selling opportunity.
 If the market is trending, then moves that break any of the STARC bands are commonly considered as trend acceleration signs. Thus, if during an uptrend the market accelerates and penetrates through the upper STARC band, the price is much less likely to retrace back to its initial level or to touch the lower boundary line. Instead, it stands a higher chance of consolidating (entering a small trading range) at the higher levels it just reached. Often, as a sign of the uptrend strengthening, the tight trading range will be followed by further acceleration, thus a flag or pennant continuation pattern will be formed.
Of course, occasionally the price will retrace back entirely to the SMA or at least partially. However, in most cases, as the uptrend continues, the SMA will have tracked higher and as the price action pulls back, it will meet the SMA at a higher price level than the initial one.