Rainbow Oscillator
This lesson will cover the following
- Explanation and calculation
- How to interpret this indicator
- Trading signals, generated by the indicator
Developed by Mel Widner and originally described in the July 1997 issue of Technical Analysis of Stocks and Commodities magazine, the Rainbow Oscillator, like the Rainbow Charts, is a trend-following indicator. It is derived from a consensus of the Rainbow Charts trends.
Similar to the Rainbow Charts, the core of the Rainbow Oscillator is a 2-period Simple Moving Average, to which recursive smoothing is applied. This way nine other moving averages are created, with each new one being based on the previous moving average. A total of ten moving averages is created, which appear in the form of a rainbow, when plotted on a chart. The oscillator is based on the following calculations:
r1: = Mov (C,2,S);
r2: = Mov (r1,2,S);
r3: = Mov (r2,2,S);
r4: = Mov (r3,2,S);
r5: = Mov (r4,2,S);
r6: = Mov (r5,2,S);
r7: = Mov (r6,2,S);
r8: = Mov (r7,2,S);
r9: = Mov (r8,2,S);
r10: = Mov (r9,2,S);
It determines the highest high and the lowest low of these moving averages. The Rainbow Charts and the Rainbow Oscillator are basically one and the same indicator, with the only difference between them being the way they are visualized.
As the Rainbow width becomes larger, this indicates that the present trend may be continuing, while if the oscillator shows a reading above 80, the market may begin showing signs of instability. The stage is set for a reversal.
If the price tends to approach the Rainbow and the oscillator line tends to be flatter, this suggests that the market tends to show signs of stability. The oscillator bandwidth will narrow. In case, however, the oscillator reading falls below 20, this implies that the stage is again set for a market reversal. The market is stable, when the oscillator readings are between 20 and 80.
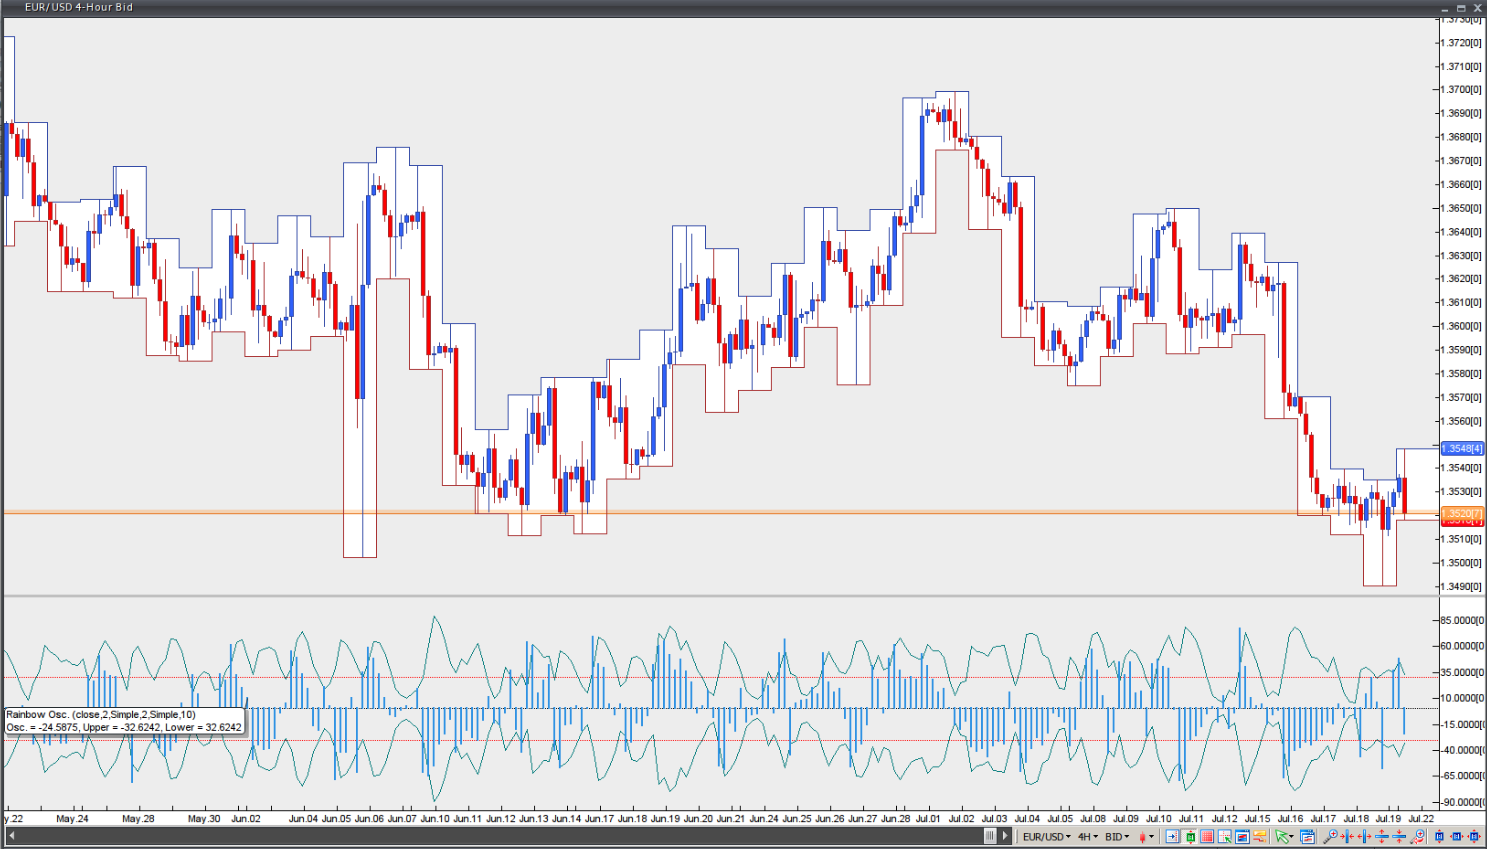
Chart Source: VT Trader