Quantitative Qualitative Estimation
This lesson will cover the following
- Explanation and calculation
- How to interpret this indicator
- Trading signals, generated by the indicator
This indicator is comprised by a smoothed Relative Strength Index and two trailing levels, based on volatility – Fast Trailing Level (Fast TL – the thin red line on the chart below) and Slow Trailing Level (Slow TL – the thin blue line on the chart below). The two are determined by calculating the Average True Range (ATR) of the smoothed RSI during a specified number of periods, after which a further ATR smoothing is applied with the use of an additional n-periods Wilders smoothing function. Ultimately, the RSIs smoothed ATR is multiplied by the Fast and Slow ATR Multipliers in order to determine the final Fast and Slow Trailing Levels.
There are several ways in which the QQE generates trading signals:
First, crossover between the RSI and the Fast ATR TL or the Slow ATR TL. In case the RSI crosses above the Fast ATR TL or the Slow ATR TL, a signal to buy is generated. In case the RSI crosses below the Fast ATR TL or the Slow ATR TL, a signal to sell is generated.
Second, the RSI crossing its 50 level. In case the RSI crosses above its 50 level, a signal to buy is generated. In case the RSI crosses below its 50 level, a signal to sell is generated.
Third, crossover between the Fast ATR TL and the Slow ATR TL. In case the Fast ATR TL crosses above the Slow ATR TL, a signal to buy is generated. In case the Fast ATR TL crosses below the Slow ATR TL, a signal to sell is generated.
Fourth, searching for divergences between the price and the QQE in order to identify a potential trend reversal or trend continuation setup. There are two types of divergences – regular and hidden. Regular divergences signal trend reversals, while hidden divergences signal trend continuation.
A regular bullish divergence is a situation, when the market forms lower lows, while the indicator forms higher lows.
A regular bearish divergence is a situation, when the market forms higher highs, while the indicator forms lower highs.
A hidden bullish divergence is a situation, when the market forms higher lows, while the indicator forms lower lows.
A hidden bearish divergence is a situation, when the market forms lower highs, while the indicator forms higher highs.
Fifth, taking advantage of overbought and oversold conditions. An overbought condition occurs, when the QQE is at or above its 70 level. An oversold condition occurs, when the QQE is at or below its 30 level. Signals are generated when any of the QQE components crosses these extremes. In case the RSI, or the Fast ATR TL or the Slow ATR TL crosses below 30 and then moves back above it, a signal to buy is generated. In case the RSI, or the Fast ATR TL or the Slow ATR TL crosses above 70 and then moves back below it, a signal to sell is generated.
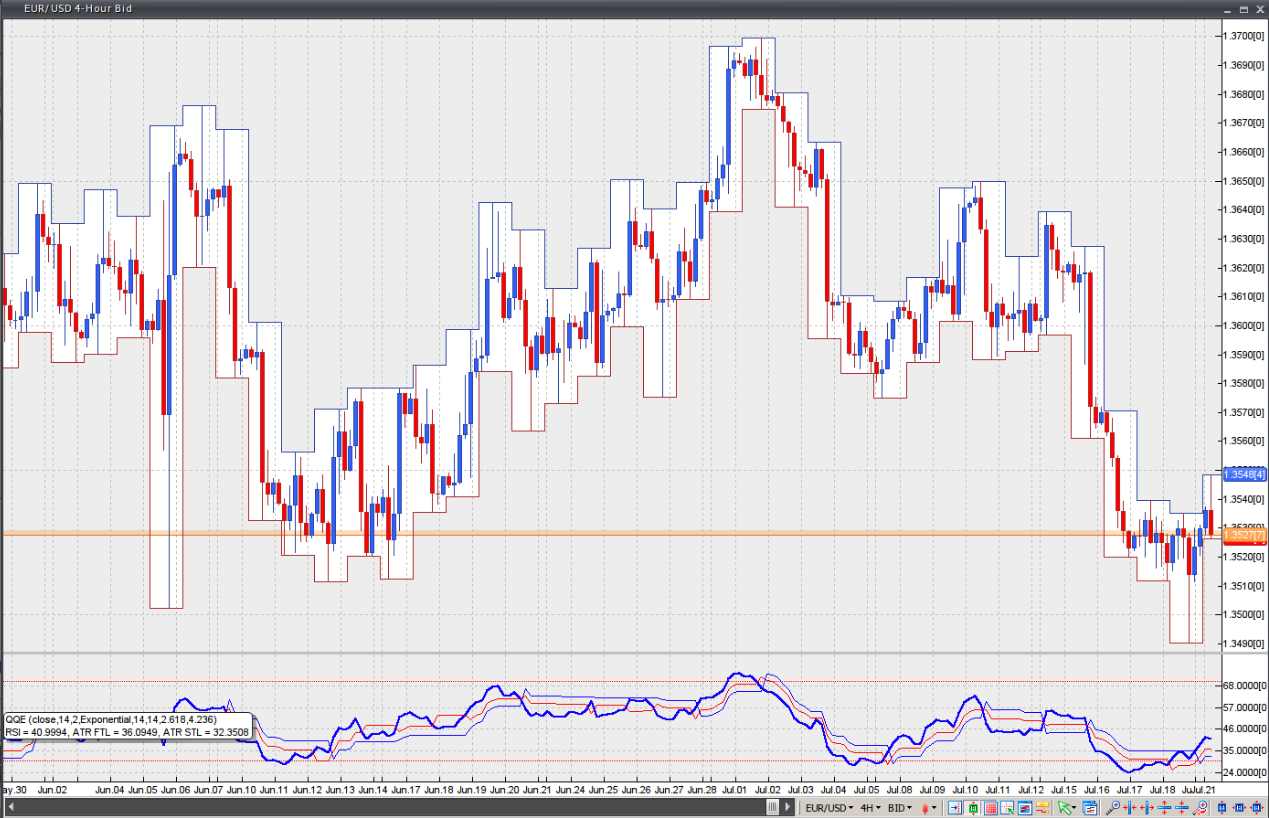
Chart Source: VT Trader