Percentage Price Oscillator
This lesson will cover the following
- Explanation and calculation
- How to interpret this indicator
- Trading signals, generated by the indicator
The Percentage Price Oscillator (PPO) is a momentum-based oscillator, which reflects the difference between two moving averages as a percentage in order to show where the fast moving average is compared to the slow moving average. The PPO is similar to the Moving Average Convergence Divergence, with the exception of the fact that the latter shows the difference between moving averages as an absolute value. The indicator is visualized as a combination of a signal line, a histogram and a centerline.
It is vital to note that Percentage Price Oscillator values are not subject to the price level of the trading instrument. PPO values regarding different trading instruments may be compared even when huge differences in their prices are present.
The Percentage Price Oscillator can be calculated as follows:
PPO = ((12-period EMA – 26-period EMA) / 26-period EMA) x 100
Signal Line = 9-period Exponential Moving Average of PPO
PPO Histogram = PPO – Signal Line
The PPO indicates whether the two moving averages converge or diverge. The PPO shows a positive value when the 12-period EMA is above the 26-period EMA. The more the 12-period EMA distances from the 26-period EMA, the more the PPO moves into positive territory. The PPO shows a negative value when the 12-period EMA is below the 26-period EMA. The more the 12-period EMA distances from the 26-period EMA, the more the PPO moves into negative territory.
The Percentage Price Oscillator is mostly used as a trend-following indicator. There are several ways in which it generates trading signals:
First, crossing over the zero line. When the PPO crosses above the zero line, a signal to buy is generated. When the PPO crosses below the zero line, a signal to sell is generated.
Second, crossing over the signal line. A signal to buy is generated, when the PPO crosses above the signal line. A signal to sell is generated, when the PPO crosses below the signal line.
Third, searching for divergences between the price and the PPO in order to identify a potential trend reversal or trend continuation setup. There are two types of divergences – regular and hidden. Regular divergences signal trend reversals, while hidden divergences signal trend continuation.
A regular bullish divergence is a situation, when the market forms lower lows, while the indicator forms higher lows.
A regular bearish divergence is a situation, when the market forms higher highs, while the indicator forms lower highs.
A hidden bullish divergence is a situation, when the market forms higher lows, while the indicator forms lower lows.
A hidden bearish divergence is a situation, when the market forms lower highs, while the indicator forms higher highs.
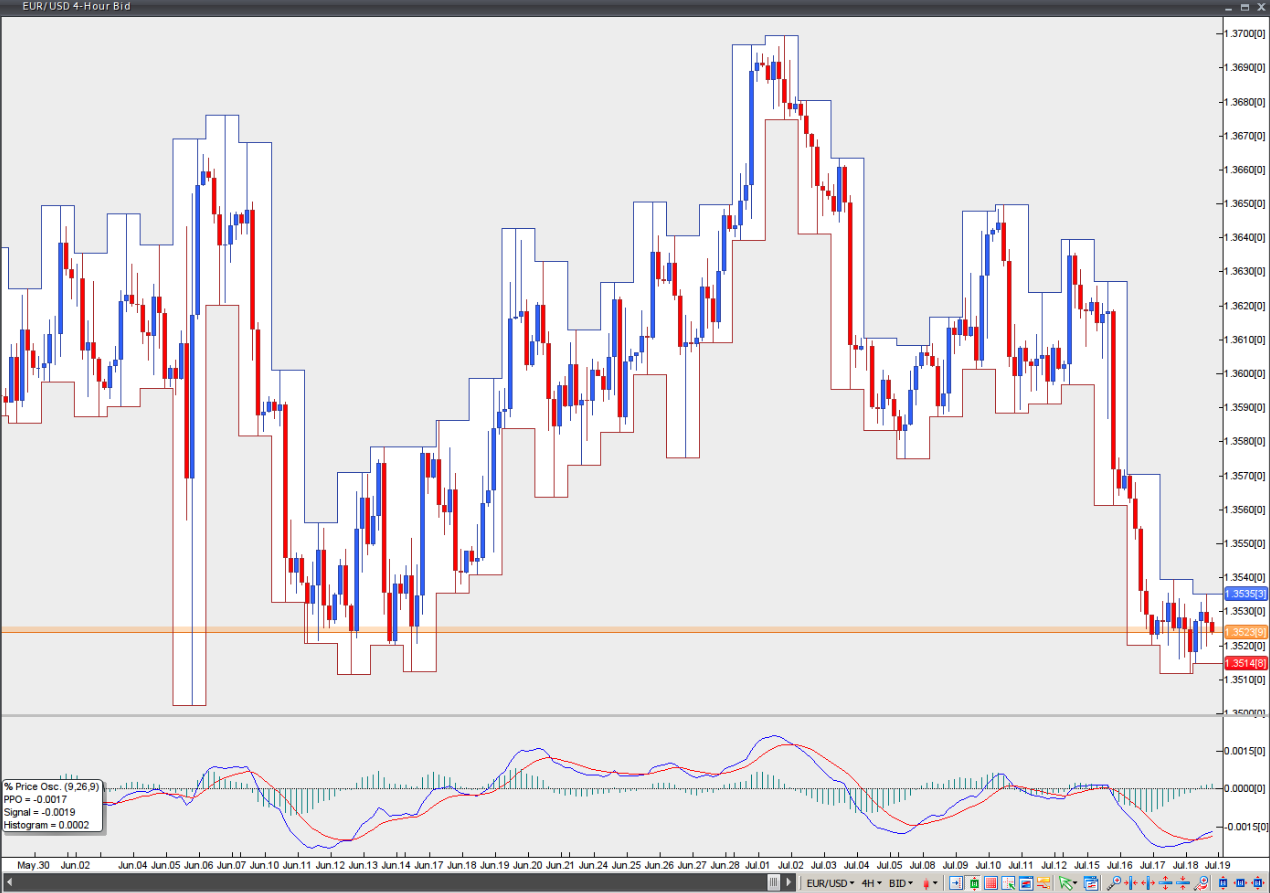
Chart Source: VT Trader