Elder-Ray Bear and Bull Power indicators
This lesson will cover the following
- Explanation and calculation
- How to interpret this indicator
- Trading signals, generated by the indicator
Developed by Dr. Alexander Elder in 1989 and introduced in his book ”Trading for a Living”, the Elder-Ray indicator is comprised by three elements – Bear Power, Bull Power and a 13-period Exponential Moving Average.
As the high price of any candle shows the maximum power of buyers and the low price of any candle shows the maximum power of sellers, Elder uses the 13-period EMA in order to present the average consensus of price value. Bull Power shows whether buyers are capable of pushing prices above the average consensus of value. Bear Power shows whether sellers are capable of pushing prices below the average consensus of value. Bull Power is the result of subtracting the 13-period EMA from the high price of the day. Bear Power is the result of subtracting the 13-period EMA from the low price of the day.
According to Alexander Elder, Bull Power should remain positive in normal circumstances, while Bear Power should remain negative in normal circumstances. In case the Bull Power indicator enters into negative territory, this implies that sellers have overcome buyers and control the market. In case the Bear Power indicator enters into positive territory, this indicates that buyers have overcome sellers and control the market. A trader should not go long at times when the Bear Power indicator is positive and he/she should not go short at times when the Bull Power indicator is negative.
13-period EMAs slope can be used in order to identify the direction of the major trend. According to Elder, the most reliable buy signals are generated, when there is a bullish divergence between the Bear Power indicator and the price (Bear Power forms higher lows, while the market forms lower lows). The most reliable sell signals are generated, when there is a bearish divergence between the Bull Power indicator and the price (Bull Power forms lower highs, while the market forms higher highs).
There are four basic conditions, required to go long or short, with the use of the Elder-Ray method alone. Alexander Elder recommends using this method in combination with the Triple Screen method.
In order to go long:
1. The market is in a bull trend, as indicated by the 13-period EMA
2. Bear Power is in negative territory, but increasing
3. The most recent Bull Power top is higher than its prior top
4. Bear Power is going up from a bullish divergence
The last two conditions are optional.
In order to go short:
1. The market is in a bear trend, as indicated by the 13-period EMA
2. Bull Power is in positive territory, but falling
3. The most recent Bear Power bottom is lower than its prior bottom
4. Bull Power is falling from a bearish divergence
The last two conditions are optional.
If a trader is willing to add to his/her position, he/she needs to:
1. add to his/her long position, when the Bear Power falls below zero and then climbs back into positive territory
2. add to his/her short position, when the Bull Power increases above zero and then drops back into negative territory.
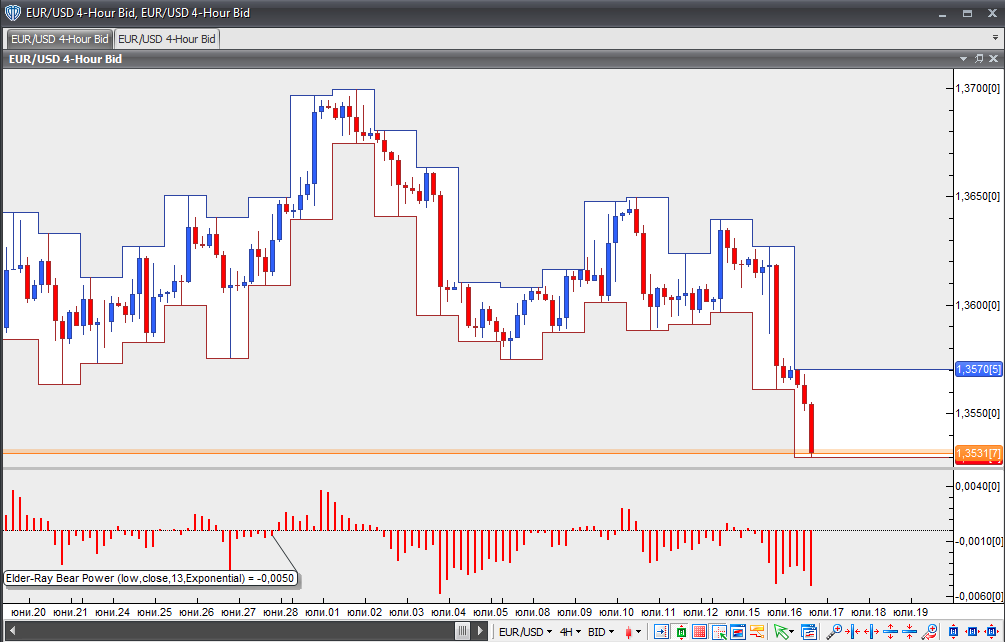
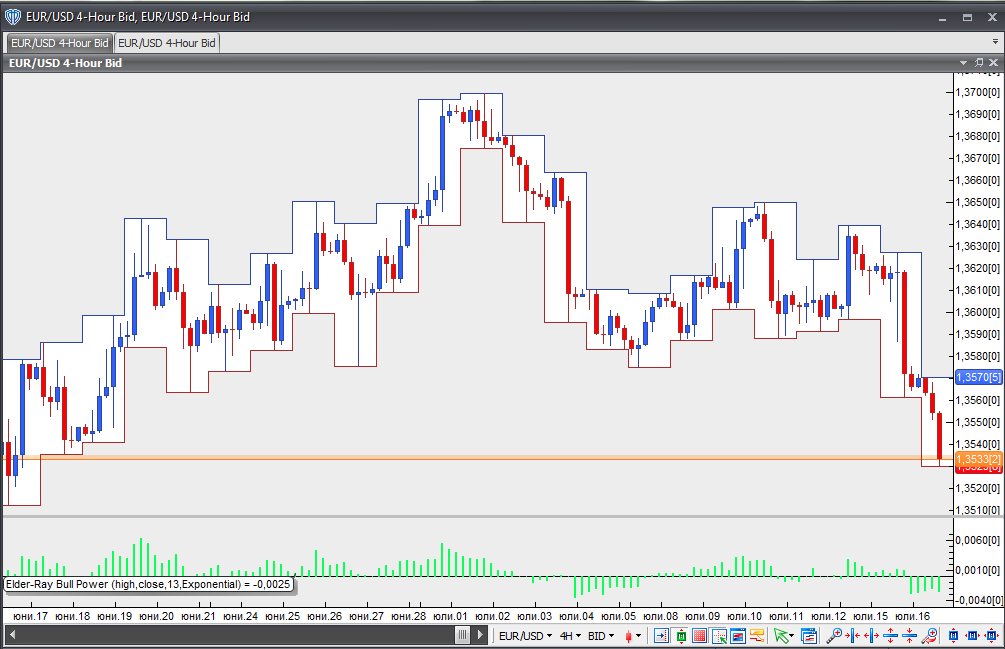
Chart Source: VT Trader
According to Elder’s Triple Screen method, the market trend should be identified on a higher time-frame chart (1-week, for example), while the Elder-Ray indicators should be applied on a lower time-frame chart (1-day). Signals should be taken according to the Elder-Ray, but only in the direction of the trend, identified on the higher time-frame chart.