Ehlers Laguerre Relative Strength Index
This lesson will cover the following
- Explanation and calculation
- How to interpret this indicator
- Trading signals, generated by the indicator
This indicator is a variation of the popular Relative Strength Index (RSI). Designed by John Ehlers, the Laguerre Relative Strength Index attempts to avoid whipsaws and lag, which traditional RSI tends to show. The Laguerre Relative Strength Index uses a four-element filter in order to provide a “time warp”, such that the low frequency elements are delayed much more than the high frequency elements. This results in a more reactive indicator, which produces less whipsaws than the traditional RSI.
Similar to the RSI, the Laguerre Relative Strength Index generates trading signals upon crossing its overbought and oversold levels. The original scale of the oscillator is from 0 to 1. A signal to buy is generated, when the Laguerre Relative Strength Index falls below the 0.15 level and then moves back above it. A signal to sell is generated, when the Laguerre Relative Strength Index climbs above the 0.85 level and then moves back below it.
In case the oscillator remains flat above its overbought level (0.85), this indicates that the bull trend is strong. In case the oscillator remains flat below its oversold level (0.15), this indicates that the bear trend is strong.
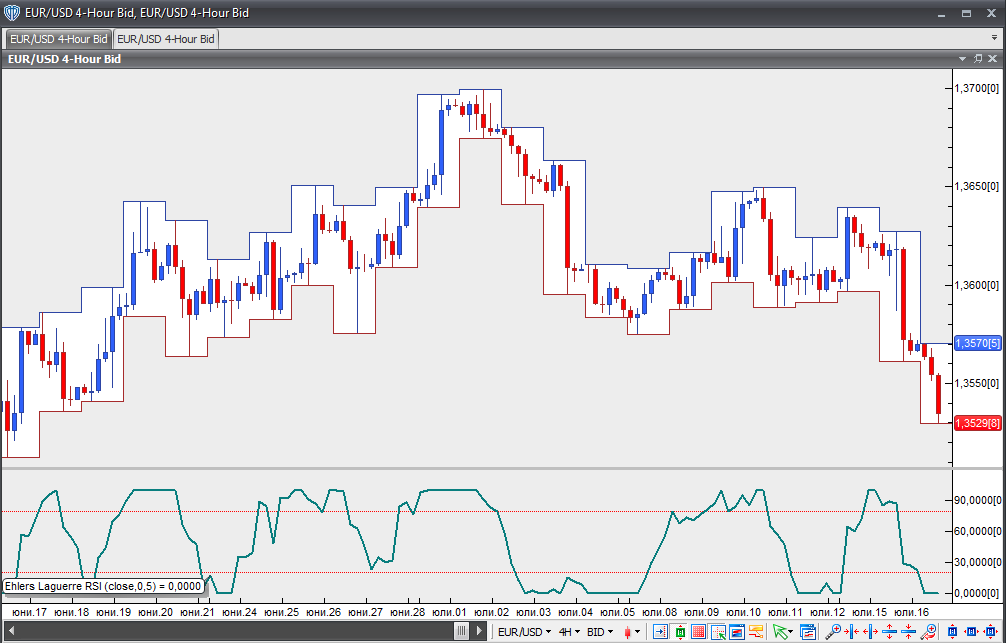
Chart Source: VT Trader