Double Stochastic Oscillator
This lesson will cover the following
- Explanation and calculation
- How to interpret this indicator
- Trading signals, generated by the indicator
The Double Stochastic Oscillator deviates from the Stochastic Oscillators, developed by George Lane. Like the original stochastic oscillators, it is a momentum-based indicator, reflecting the current closing price in relation to the high/low range over a specified period. It oscillates between 0 and 100. The Double Stochastic Oscillator presumes that during an uptrend the price will close in proximity to the high of the range and during a downtrend the price will close in proximity to the low of the range.
The Double Stochastic Oscillator is presented by two lines – %K, the main (fast) line and %D, the signal (slow) line.
Fast %K = ((Todays Close – Lowest Low in %K Periods) / (Highest High in %K Periods – Lowest Low in %K Periods)) x 100
Slowing %K = n-period moving average of Fast %K
Double %K = ((Todays Slowing %K – Lowest Low Slowing %K in %K Periods) / (Highest High Slowing %K in %K Periods – Lowest Low Slowing %K in %K Periods)) x 100
Double Slowing %K = n-period moving average of Double %K
%D = 3-period Simple Moving Average of Double Slowing %K
The Double Stochastic can generate several types of trading signals:
First, crossovers of the %K line and %D line. A trader is provided with the opportunity to buy, when the %K line crosses above the %D line. A trader is provided with the opportunity to sell, when the %K line crosses below the %D line.
Second, there is another type of crossover, which a trader may use. He/she may go long, when the %K line crosses above the 50 level. He/she may go short, when the %D line crosses below the 50 level.
Third, searching for divergences between the price and the Double Stochastic in order to identify a potential trend reversal or trend continuation setup. There are two types of divergences – regular and hidden. Regular divergences signal trend reversals, while hidden divergences signal trend continuation.
A regular bullish divergence is a situation, when the market forms lower lows, while the indicator forms higher lows.
A regular bearish divergence is a situation, when the market forms higher highs, while the indicator forms lower highs.
A hidden bullish divergence is a situation, when the market forms higher lows, while the indicator forms lower lows.
A hidden bearish divergence is a situation, when the market forms lower highs, while the indicator forms higher highs.
Fourth, taking advantage of overbought and oversold conditions. An overbought condition occurs, when the Double Stochastic is at or above the 80 level. An oversold condition occurs, when the Double Stochastic is at or below the 20 level. A buy signal is generated, when the oscillator falls below the 20 level and then moves back above it. A sell signal is generated, when the oscillator climbs above the 80 level and then moves back below it.
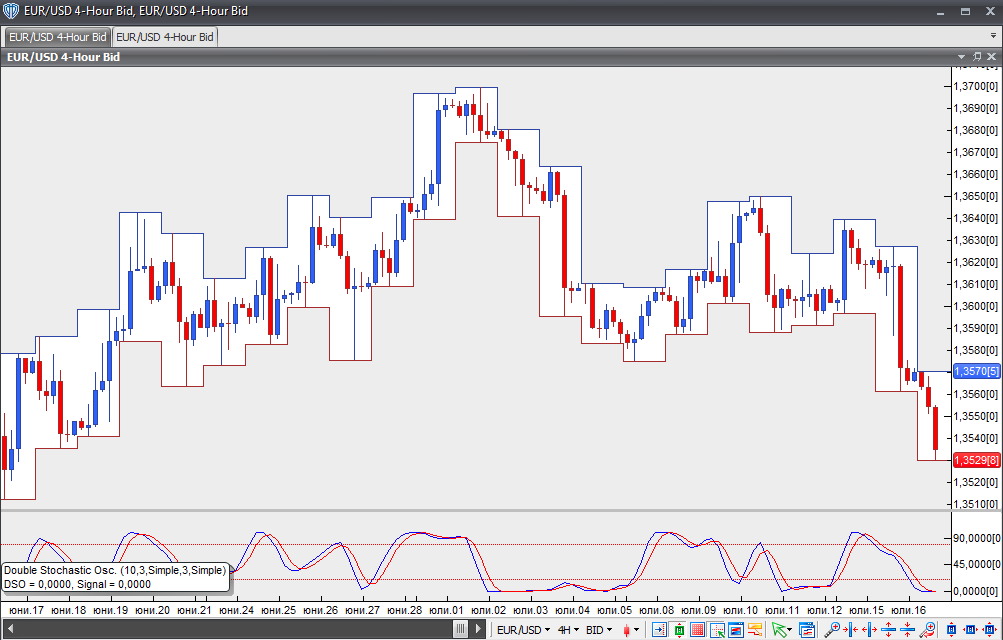
Chart Source: VT Trader