Donchian Channel
This lesson will cover the following
- Explanation and calculation
- How to interpret this indicator
- Trading signals, generated by the indicator
The Donchian Channel is a trend-following indicator, developed by Richard Donchian. The two outer bands are plotted through the highest high and the lowest low over a specified period, originally 20 days. A third (middle) band can optionally be plotted, as it represents the average of the two outer bands.
Within a trending environment trading signals can be generated as follows:
If the price moves above the upper band of the channel (the 4-week high if the original 20-day period is used), it is a signal to buy.
If the price moves below the lower band of the channel (the 4-week low if the original 20-day period is used), it is a signal to sell.
The main objective is to make an entry as early as possible, on a breakout, and ride the trend for as long as possible.
There is another trading approach, a variation of the Donchian system, known as Turtle trading. It was introduced by Curtis Faith in his book ”Way Of The Turtle”. The trading rules are as follows:
A trader needs to make a long entry, when the price moves above the 20-day upper bound of the Donchian channel and close his/her position, when the price breaks the 10-day lower bound of the channel.
A trader needs to make a short entry, when the price moves below the 20-day lower bound of the Donchian channel and close his/her position, when the price breaks the 10-day upper bound of the channel.
A trader may use a 25-period and a 350-period Exponential Moving Averages as a trend filter. A long position should be taken only if the 25-period EMA is above the 350-period EMA. A short position should be taken only if the 25-period EMA is below the 350-period EMA.
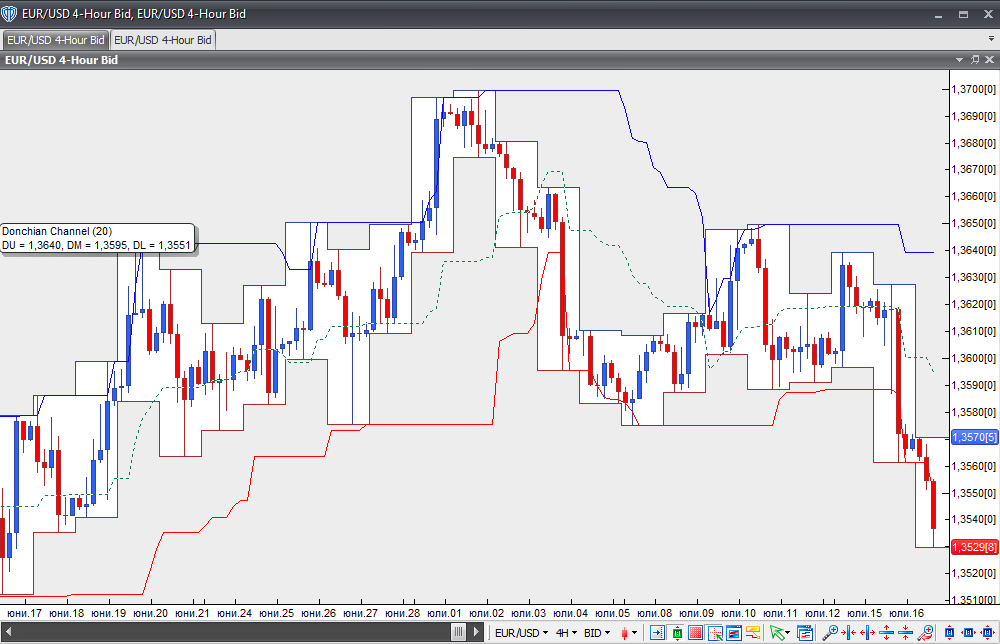
Chart Source: VT Trader