DeMarks Projected Range
This lesson will cover the following
- Definition
- Interpretation
Developed by Tom DeMark, DeMarks Projected Range is a technical indicator used to project the high and low, thus the range, of the next bar based on the most recent bar.
The calculation of the next bars values is based on the previous bars open and close prices (whether the close is higher, equal or lower than the open). Thus, if we are trading on a daily time frame, DeMarks Projected Range will attempt to predict the next days trading range based on price movement during the current day.
The indicator is visualized as a couple of dots, each plotted beneath and above the period of interest. In some platforms the dots may be replaced by a line. The following screenshot presents exactly such a type of visualization.
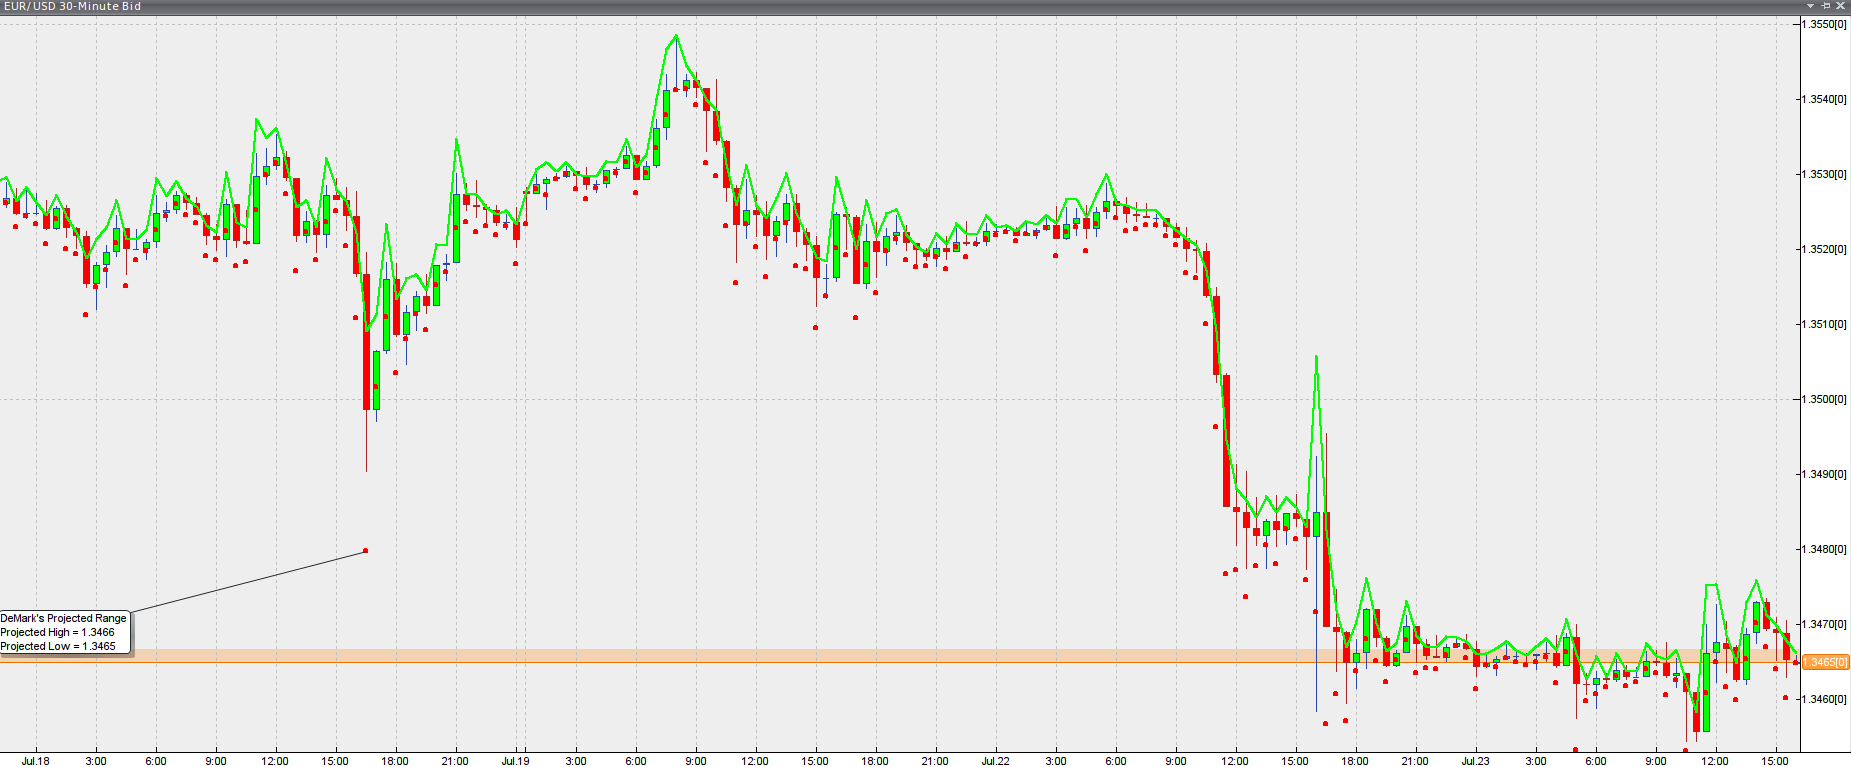
Chart source: VT Trader
The interpretation of the indicators values is quite straightforward: if the next bar opens within the forecast range, the price is likely to remain within those boundaries throughout the period. If the price opens above the projected range (its high), the market is likely to continue with an uptrend. Conversely, if the candlestick opens beneath the low of the predicted range, the price is expected to perform a downward move.