Chandes Variable Index Dynamic Average
This lesson will cover the following
- Definition
- Calculation
- Interpretation
Another indicator developed by Tushar Chande, the Variable Index Dynamic Average is a method of calculating an Exponential Moving Average which however does not use a static period of averaging, rather automatically alters its speed in accordance to shifts in market volatility.
This oscillator uses the CMO value (Chandes Momentum Oscillator) as a gauge of volatility. It measures the ratio between the sum of positive and negative increments for a certain period. The CMO value is then used in the calculation of the Variable Index Dynamic Average. Here is how the math looks like.
The standard Exponential Moving Average is calculated as follows:
EMA(i) = Price(i) * F + EMA(i-1)*(1-F), where:
– Price(i) is the current price
– F is the smoothing factor and is equal to: 2/(Period_EMA+1), where Period_EMA is the EMA averaging period
– EMA(i-1) is the EMAs previous value.
The value of Chandes Momentum Oscillator is calculated using the following formula:
CMO(i) = [UpSum(i) – DnSum(i)] / [UpSum(i) + DnSum(i)], where:
– UpSum(i) is the current sum of positive price increments for the period
– DnSum(i) is the current sum of negative price increments for the period.
The VIDYA is calculated as follows:
VIDYA(i) = Price(i) * F * ABS[CMO(i)] + VIDYA(i-1) * {1 – F* ABS[CMO(i)]}, where
– ABS[CMO(i)] is the absolute current value of the Chande Momentum Oscillator
– VIDYA(i-1) is the VIDYAs previous value.
Chandes Variable Index Dynamic Average is used as a replacement of traditional moving averages. Also, its boundaries, which are placed above and below the VIDYA at a certain percentage distance, create a channel which is traded in a similar way to Bollinger Bands. The following screenshot illustrates the VIDYA in a trading platform.
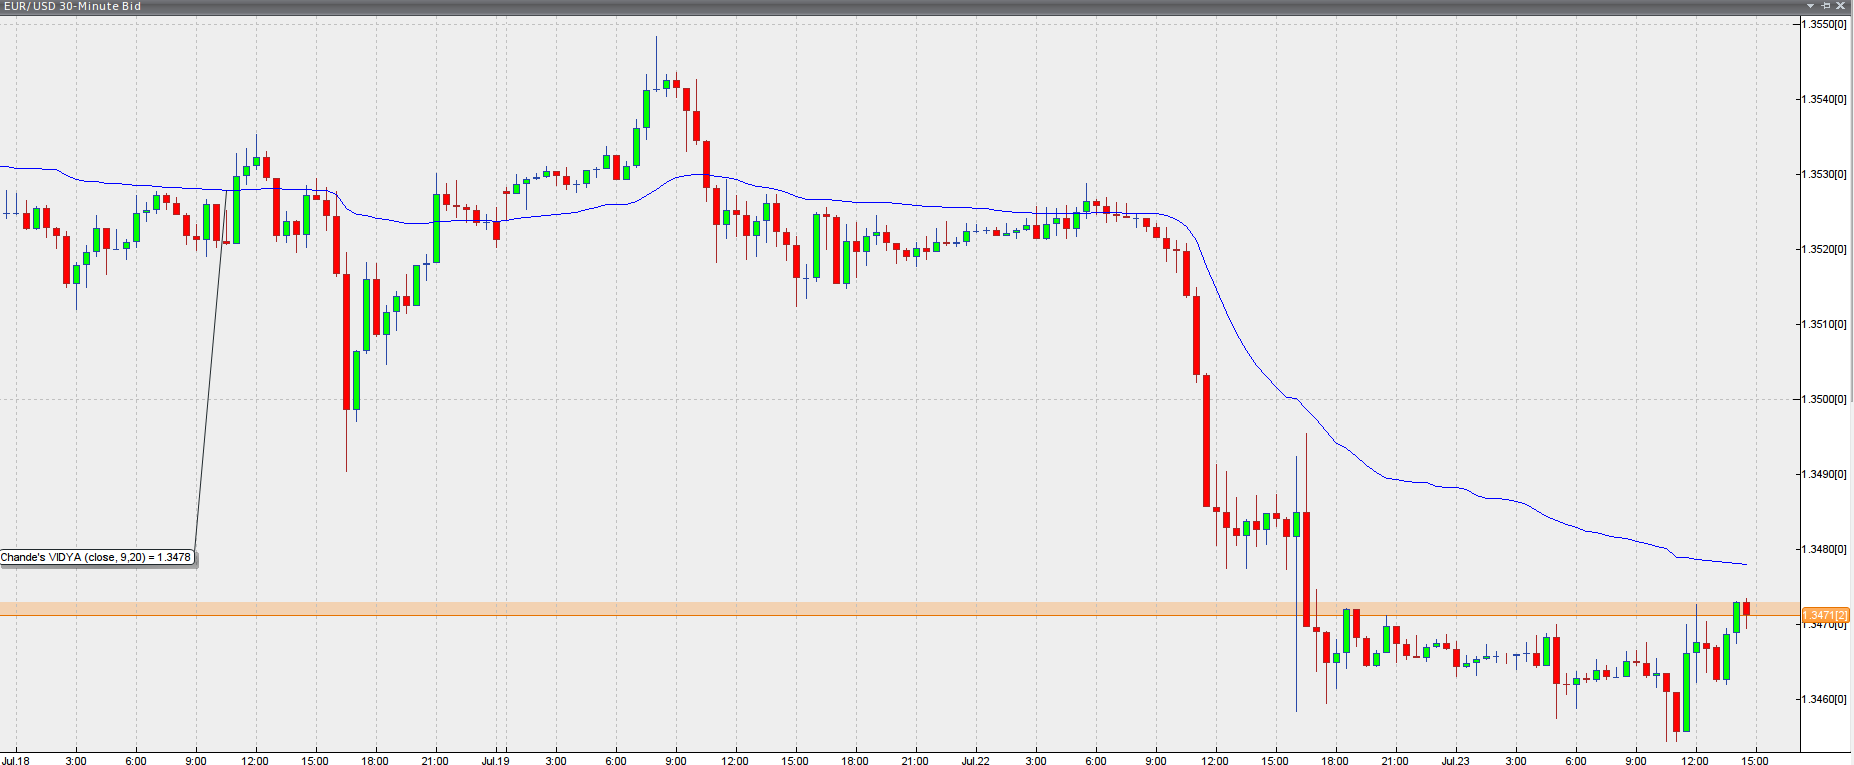
Chart source: VT Trader