Moving average crossover
This lesson will cover the following
- What is a moving average crossover?
- Learn about Golden Cross and Death Cross
- What is a moving average envelope?
Different investors use moving averages for different reasons. Some apply them as their primary analytic tool, while others simply use them as a confidence builder to back up their investment decisions.
No matter how usefulmoving averages can be due to the vital data they provide us with, they all suffer one common limitation – they are a lagging indicator. By the time an 89-day MA curves upward or downward to confirm a trend, the market has already exhausted a part of that move and may even be nearing its end. Sure, a 20-day moving average will reflect price movement in a swifter manner, but it will still lag behind. And although exponential averages speed up signals, all MAs join the trading party too late. This is why traders do not base their trading decisions solely on moving averages and generally wait for the strongest possible signals they generate – crossovers.
Crossovers
A moving average crossover occurs when a short-term average crosses through a long-term average as shown in the graph below (20-day yellow line crosses the 80-day red line).
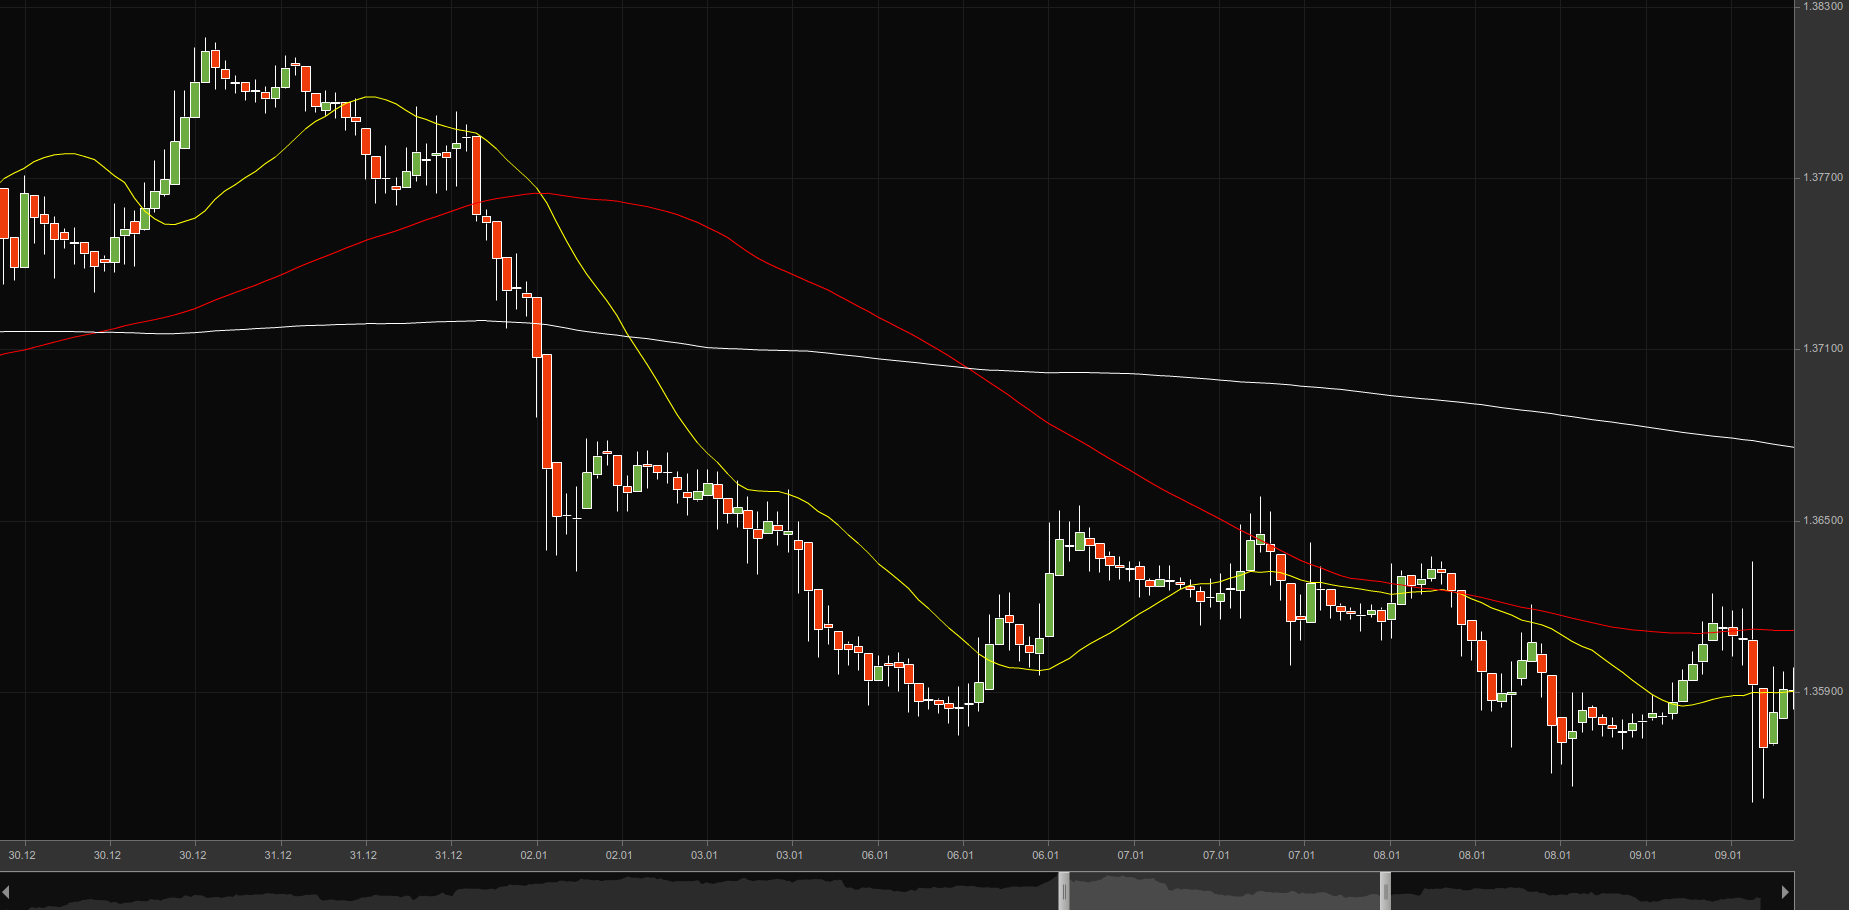
This signal indicates to traders that a strong move is likely to come as momentum shifts in one direction. A sell signal (like in our case) is generated when the short-term average crosses below the long-term average, while a bullish signal is at hand when the short-term average penetrates a long-term average and curves upward.
Crossovers generate very strong and objective trading signals, which is why they are so popular. Apart from signifying important shifts in momentum, they also indicate changes in support/resistance levels regardless of holding period. They themselves play the role of a support and resistance, something which weve explained in the respective article, and therefore crossovers and the following results are very similar to breakouts.
Golden Cross and Death Cross
 Long-term crossovers are of greater significance than short-term ones, so we will next make you familiar with the concepts of the Golden and the Death crosses.
The Golden Cross reflects a major shift in market sentiment when bulls prevail over bears. It is formed when a medium-term moving average, say a 50-day one, breaks above the long-term moving average, for example a 200-day MA.
Conversely, the Death Cross signifies a condition when the market is once again dominated by bears, visualized by the medium-term average crossing below the 200-day one.
Once penetrated, the 200-day MA begins to act as a major resistance level after the medium-term average drops below it, and major support following an upward breakout. Very often you can see the price action getting trapped between the medium-period and the long-term average, continuously whipsawing between their price extremes. This zone presents a great opportunity for swing trades.
 Traders use crossovers as a confirmation tool in a good number of trading strategies. However, keep in mind that moving averages are trending indicators, used to measure directional momentum. Continuous ranging markets limit the effectiveness of all moving averages, as the MAs eventually converge toward a single price level. Especially when price action is so thin that it is visualized almost as a flat line, moving averages can give you little-to-no clues about market direction.
This renders them generally ineffective in ranging markets and causes them to generate false signals, thus you must limit their use as a base for decision making to markets with a distinct trend. Such a situation (sideways trading) then calls for the abandonment of averages and the use of oscillators (such as Stochastic, RSI etc.) to predict the next move.
Moving Average Envelopes
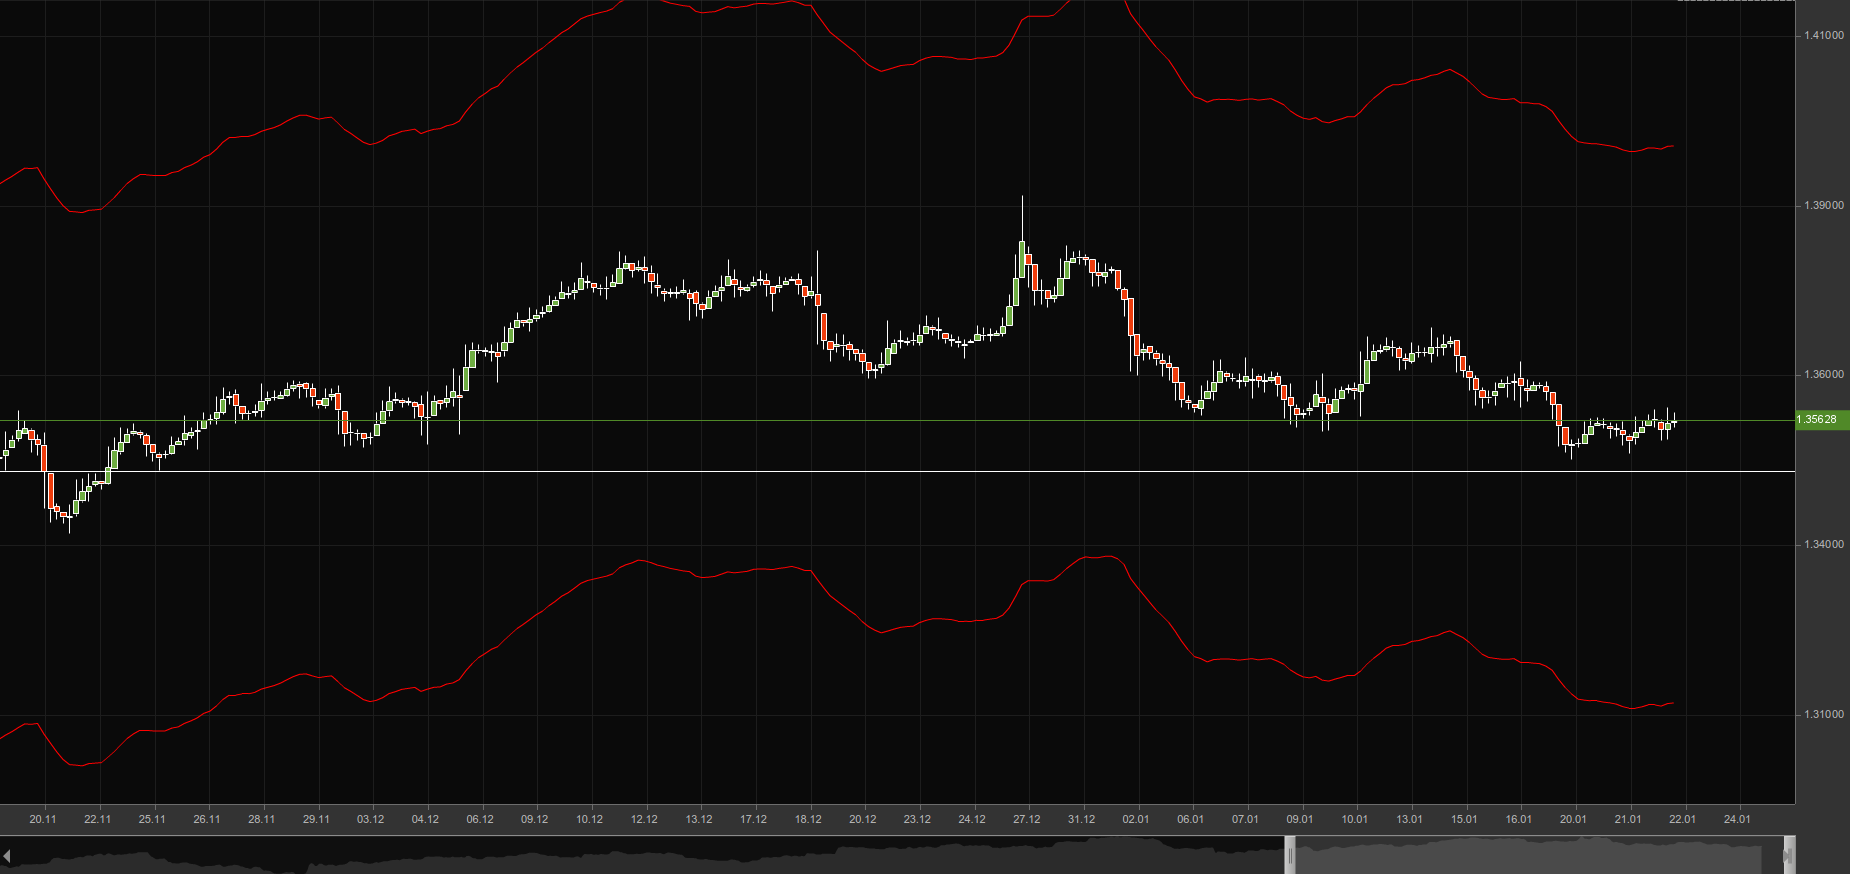
Envelopes are basically two boundaries placed at certain percentages above and below the moving averages. The price deviating too far from the moving average and hitting one of the two boundaries indicates that the market has become overextended. Such a sudden spike often leads to a price correction, since the overextended movement is usually not sustainable.
There is no general rule how far away from the MA a trader should place his envelope, as in what percentage he/she should use. Short-term moving averages are commonly accompanied by smaller envelopes, while long-term ones are coupled with bigger envelopes.
Short-term moving averages, such as a 20-day one, are often surrounded by a 3% or even smaller envelope. Long-term traders commonly use a 5% or a larger envelope around mid- and long-term moving averages.
However, each trader has to decide for himself what percentage envelope to use according to the currency observed. Through try and error you should adjust the channel in a way that it wraps all or the most of recent breakouts.