Introduction to Moving Averages
This lesson will cover the following
- ing average stands for the aver
- What is a moving average?
- How to follow trends with it?
- Types of moving averages
- Moving average as support and resistance
Moving averages are among the most popular and widely used indicators. They represent a method of smoothing price data and removing noise to reveal and measure a trend. Moving averages are the basis of many technical trend-following systems. Being a trend following, lagging indicator, as the moving average always lags price action, they are used in order to confirm trends, once the latter have begun. Comparison between moving averages of different time periods can also show market momentum.
Example
 A moving average stands for the average value of a given set of data. For example, a moving average could use information, such as the closing price, over a given period of time, say the previous 20 trading days. In this example, the moving average adds the closing prices over the previous 20 trading days and divides them by 20 to produce an average value.
Trend Following tool
 Moving averages are usually a trend following tool. As they are a lagging indicator, they can tell us that a trend has started only after it already happens. The closing price is considered the most important price level of the trading day and is the figure most commonly used in calculating a moving average. A midpoint can also be used. Some technical analysts use an average of the high, low and closing prices. Price bands can also be created by averaging the high and low prices separately.
Let us provide an example with a 20-period moving average on a 10-minute chart. Every single point of the moving average is calculated from the average close price of the last 20 ten-minute candles. With every new ten-minute candle on the chart, the moving average will continue to use the average close price of the most recent twenty periods. This results in a continuous line.
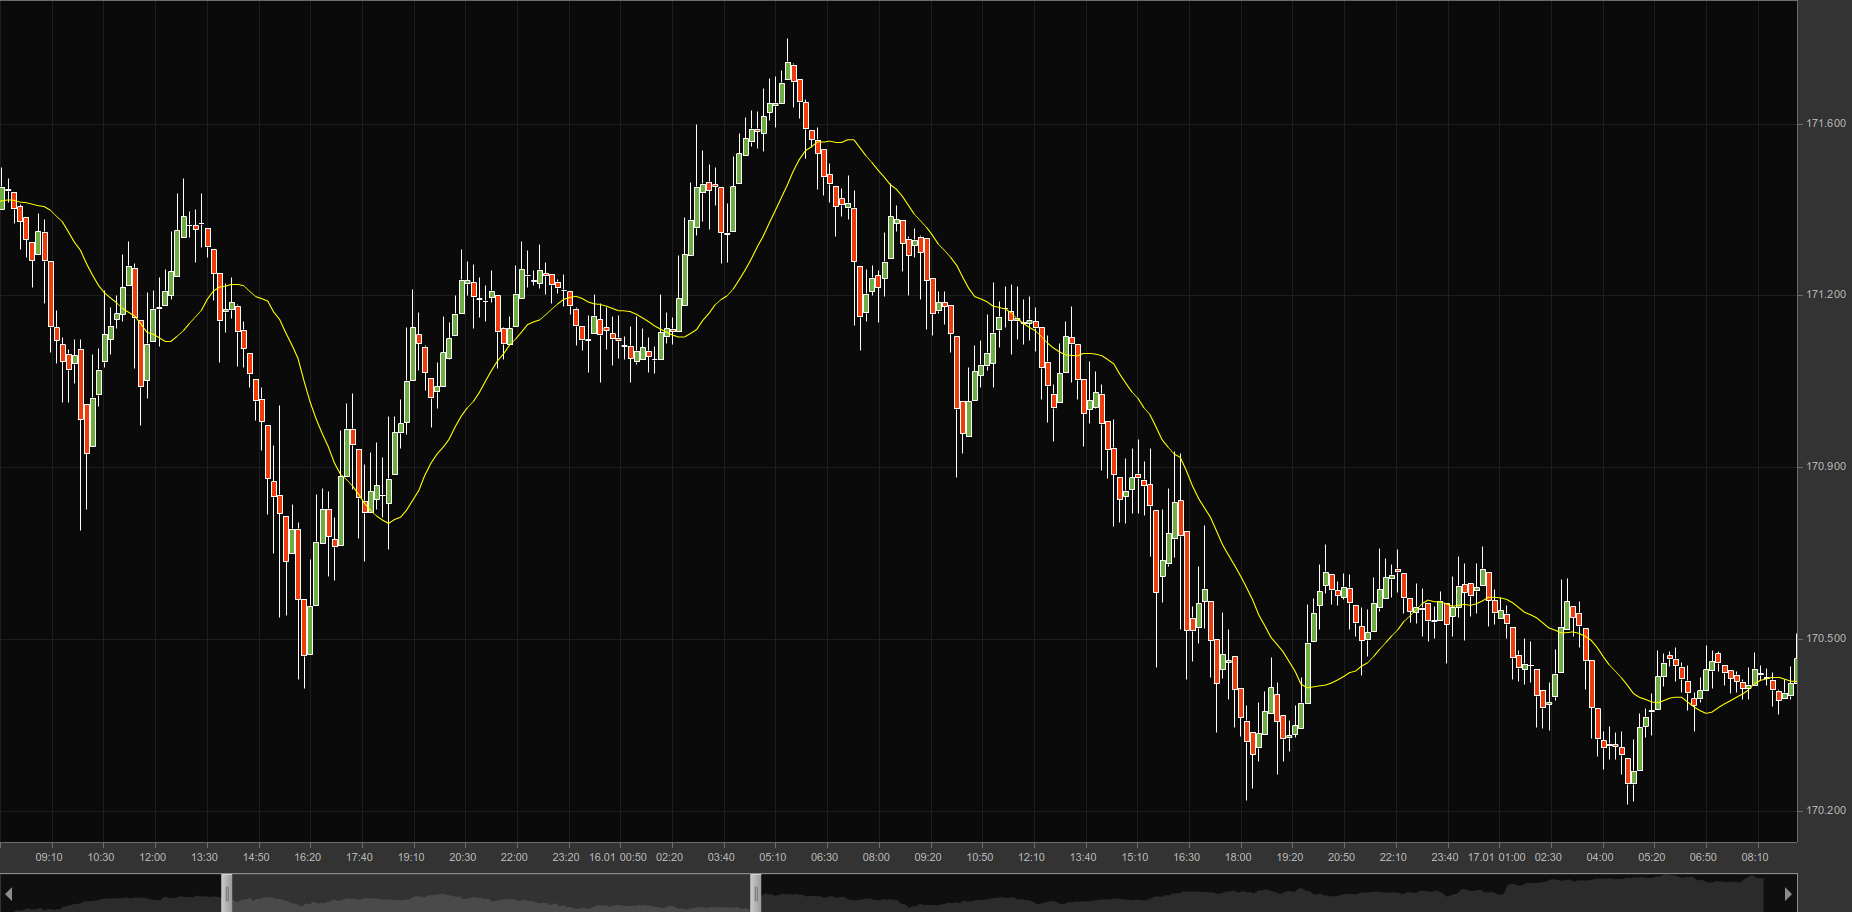 A moving average may not always be 20 periods. It can be adjusted, so that a trader can use whatever period he/she would prefer.
Moving averages come in various forms, but their underlying purpose remains the same: to help technical traders track the trends of financial assets by smoothing out the day-to-day price fluctuations, or noise. By identifying trends, moving averages allow traders to make those trends work in their favor and increase the number of winning trades.
Different types of moving averages
 Four types of moving averages can be recognized: Simple, Exponential, Linear weighted and Smooth weighted.
The fundamental difference between these types of moving averages lies in the way they are calculated. Because of this, they appear differently on the price chart. The simple moving average uses each period with equal weighting in its calculations. The exponential, linear and smooth weighted averages emphasize the most recent periods in the calculations.
Linearly weighted moving average is a type of moving average that puts a higher weighting on the recent price data, than does the common simple moving average. However, the popularity of this moving average has been diminished by the exponential moving average. The same could be said about the smooth weighted average, which is rarely used in trading. That is why in our next articles we shall pay attention to the first two types of moving averages – the simple and the exponential.
How to choose the period of Moving Averages
 No specific rules exist when a trader selects the number of periods for a given moving average. In most cases, the choice of periods is entirely up to the person. As different periods for moving averages are used, one can divide them into short-term averages (10-30 periods), medium-term averages (30-80 periods) and long-term averages (100-200 periods).
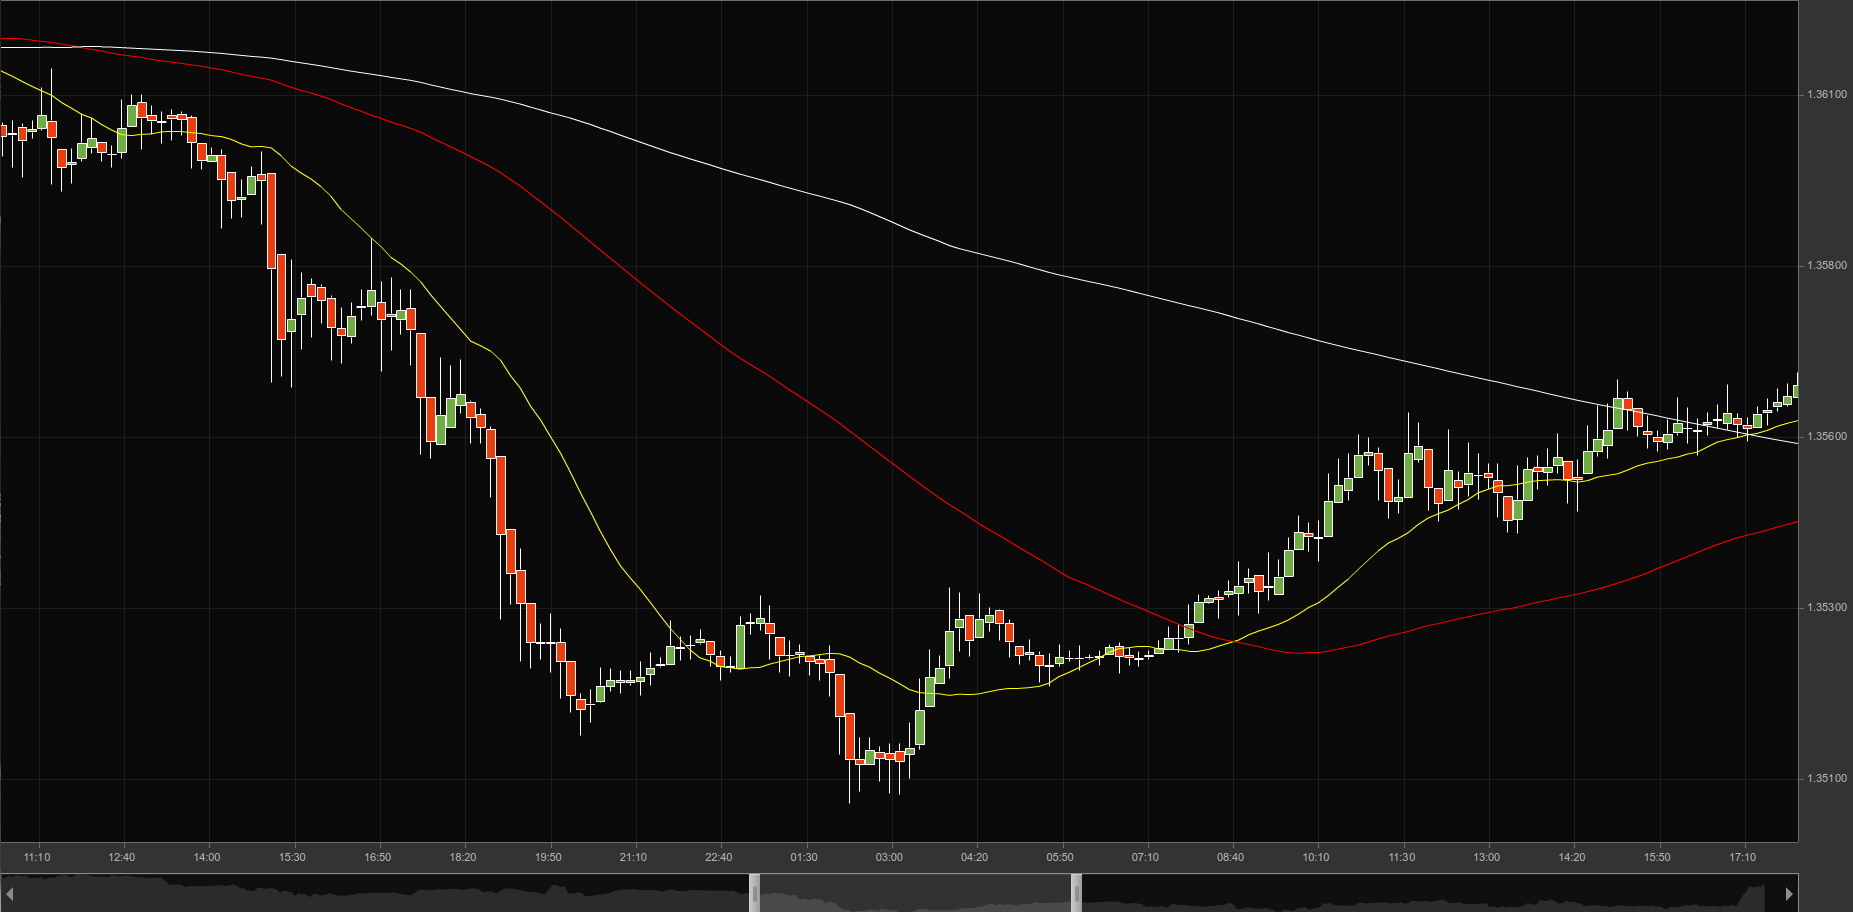
The shorter the period of a moving average, the more rapidly it will change with price action. However, it is more likely to provide less reliable signals compared to those provided by a longer-term moving average.
The longer the period of a moving average, the more slowly it will change with price action. However, the signals it provides are more reliable.
A 5-period moving average will take into consideration the last 5 periods, thus, it will react to the change in price direction in a very rapid manner. The main disadvantage to this is that a trader will likely receive false signals in the trend change, as short-term spikes in prices may appear.
On the other hand, a 200-period moving average will require a longer period of time to react, but will likely provide a lesser number of false signals. The main disadvantage to this is that produced signals may be less frequent, because of the slower reaction.
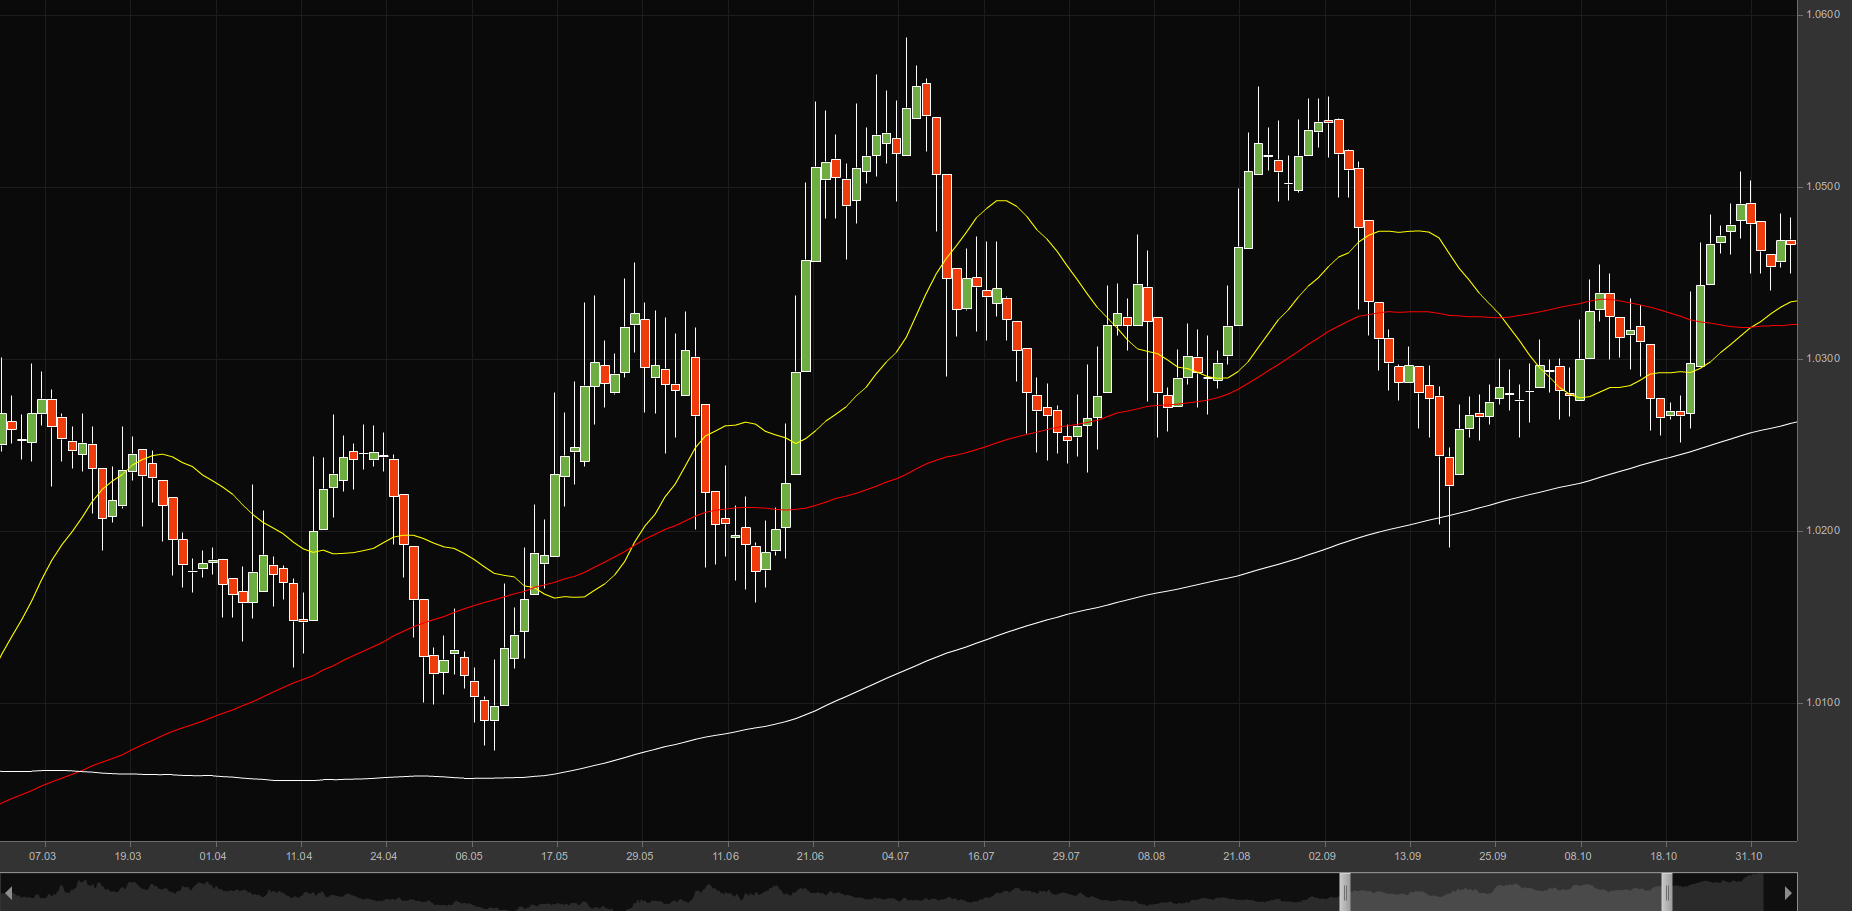
In the chart we provide below one can see how the 20-period moving average (yellow line) changes its direction much more rapidly with the change in price action, while the 200-period moving average (white line) fails to do so. Also, one can see an 80-day moving average (red line).
Using moving averages as support and resistance
 Moving averages can be used as support or resistance when a trader looks for a possible entry or exit in the market. This can also be said in the following way. In case the price makes a contact with the moving average on the price chart, the trader, examining closely this chart, will enter either into a long, or into a short position. Actually, this works in the same way as horizontal support or resistance lines.
Moving averages are known as dynamic support and resistance, simply because they tend to change with prices.
In case current price action is above the moving average, the latter will act as a support. As you can see from the graph, the white line, the 200-day simple moving average, is acting as a support.
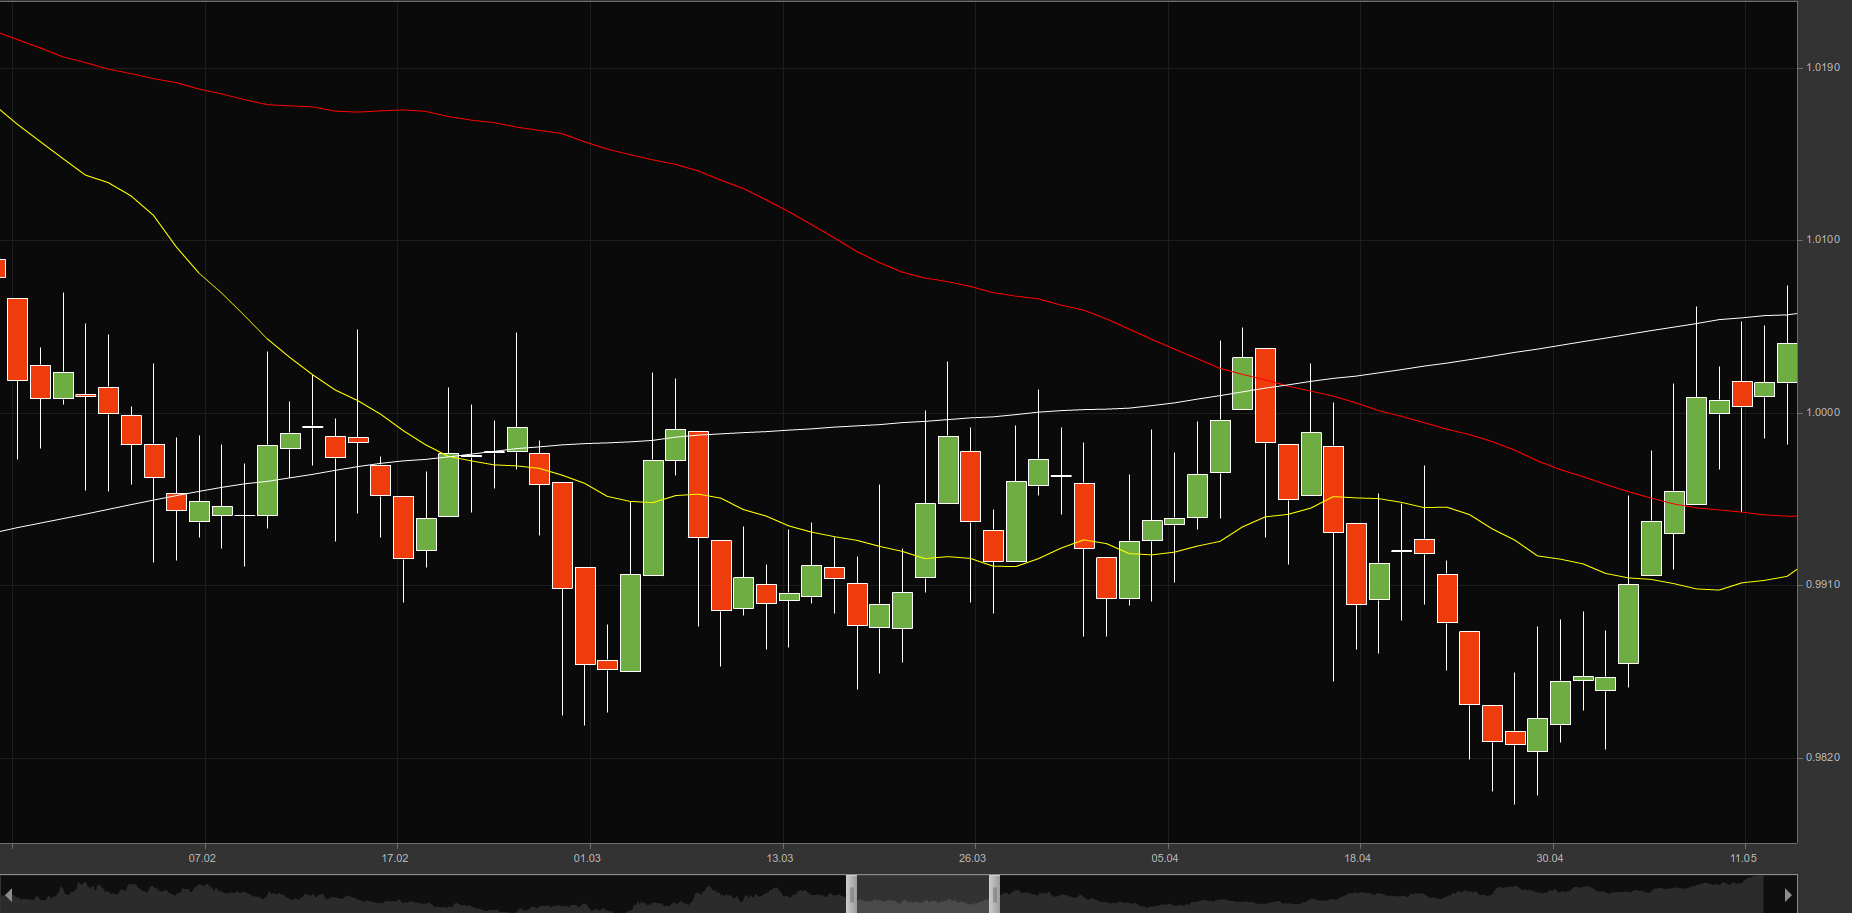
In case current price action is below the moving average, the latter will act as a resistance. The graph above shows how the same 200-day moving average is acting as a resistance.