Channels
This lesson will cover the following
- What is a channel and how does it work
- How is a channel drawn
- What are the different types of channels
- How can you trade a channel
Channels are a concept in technical analysis used successfully by a large number of traders. A channel is a trading range bound by a trend line and a concurrent line, plotted through the opposite peaks or troughs. There are three types of channels depending on the price direction – an ascending channel, a descending channel, or a sideways channel, also known as a ranging channel.
How is a channel drawn
 In order to draw a channel, we need to have determined whether we have an uptrend or downtrend. Forming an ascending channel requires from the market to be creating higher highs and higher lows at relatively the same pace. Similarly, in order to draw a descending channel, the market needs to be forming lower highs and lower lows with the same speed.
Plotting a channel is very simple, if you know how to draft a trend line, something which we have already explained in the article “The Trend – a Traders Best Friend”. Once youve successfully placed your trend line, you need to draw a parallel line with relatively the same length and tipped at the same angle as the trend line, and project it into the future.
As you already know, uptrend lines should be plotted between support troughs, which means that when the market is trending up, the trend line lies below the price action. Logically, downtrend lines should be plotted between resistance peaks, meaning that when the market is trending down, the trend line appears above the price action.
This means that the parallel line we need to draw should be dragged through the most recent high, in case of an uptrend, or the most recent low, if prices are trending down.
 Dont forget that as when plotting trend lines, you should not be forcing the parallel lines, if they are not matching the market action. If the market has created lows and highs in such a way that the two lines running through them are not concurrent, then this is not a channel and you should not try to fit them to illustrate parallel movement.
How do channels actually work?
Channels basically are sustained by traders who have identified them and use them in order to enter and exit trades. The following example will show what the general principle of channel movement is.

Lets assume that our asset stood at $10 at some point and overall market sentiment is bullish. As most people begin buying, demand will exceed supply, causing the price to jump.
However, at $13.50, those buyers feel that the price has risen enough and theyve made sufficient profit, so they decide to close their positions, which means they are effectively selling. At this point, supply begins to exceed demand, which drives prices down to lets say $11.
After the asset becomes cheap, market players decide this is an appropriate moment to enter into a long position and benefit from an alleged price gain.
 As demand once again outstrips supply, it lifts the price to, say $14. However, at this point traders might decide that the price has risen too much and a further advance is unsustainable, because it exceeded the previous high of $13.50. This will force many market players to begin selling in order to secure their profit, thus applying downward pressure on the market.
As prices commence another drop and fall to, say $11.50, broad market sentiment shifts as most traders assess that the asset has dropped too much. This spurs a series of long entries, which again bumps the prices up and continues the upward spiral movement. Logically, this principle works the other way around as well, thus forming a descending channel.
However, eventually we might see that a resistance reversal point begins to close on the underlying trend line and is no longer concurrent on the upper channel line. This is evidence that sellers are getting more anxious, which means that the price is coming closer to a reversal point. Inevitably, a breakout will occur.
Types of channels
In accordance to the market trend, you can have an ascending channel (upchannel), a descending channel (downchannel), or a sideways channel (ranging channel).
Ascending channel
An ascending channel is an upward tipped trading range, which surrounds the price movement as the market forms higher highs and higher lows at the same pace. You can see one illustrated on the screenshot below.
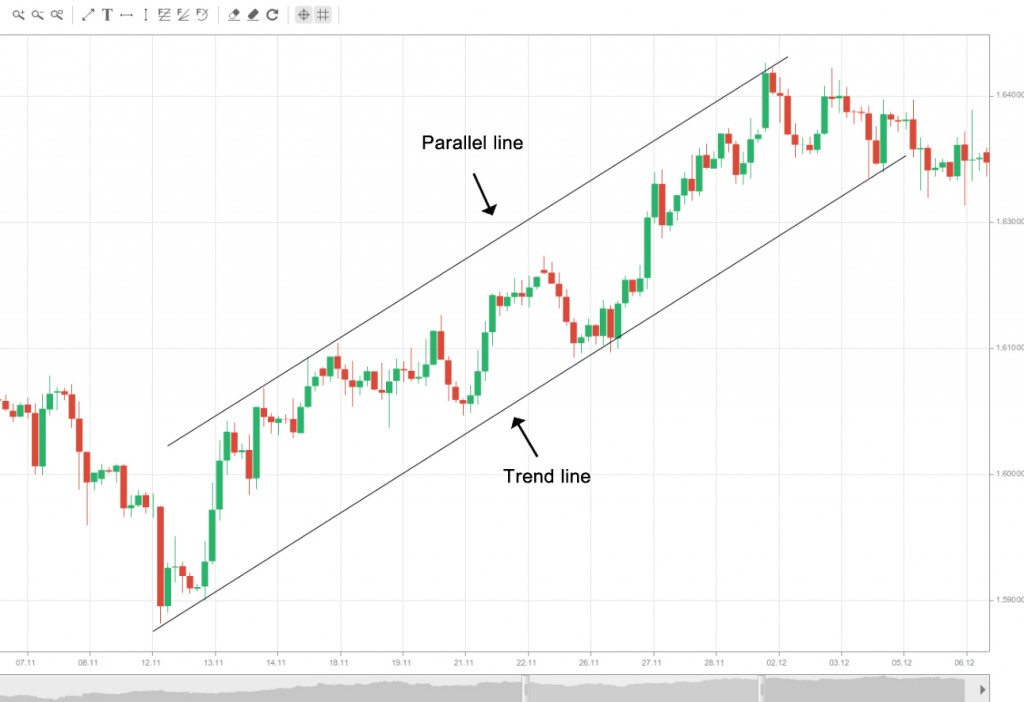
As you can see from the example, the market is forming new highs and new lows with an equal amount of price movement to the upside, which renders the lines going through them (the trend line and its clone) parallel.
In order to draw an ascending channel you need to do the following:
1. Draw a trend line as described earlier.
2. Draw another line tipped at the same angle and adjust its length in accordance to the projected channel.
3. Drag the concurrent line and place it, so that it runs through the most recent high.
4. If this is an actual ascending channel, then all the previous highs should lay on the cloned line, or deviate very slightly at most.
5. Do not attempt to forcefully make the second line become parallel to the trend line. If they are mismatching, then you simply dont have a channel.
Descending channel
A descending channel is a downward tipped trading range, which surrounds the price movement as the market forms lower highs and lower lows at the same pace. You can see a downchannel visualized below.
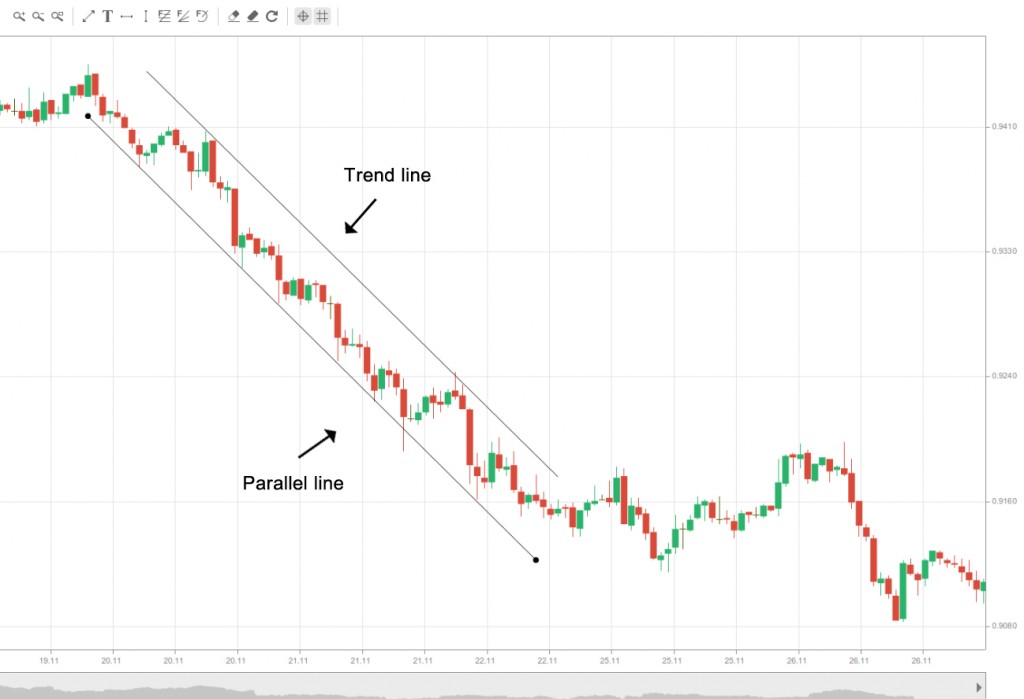
In order to draw a descending channel, you need to follow the same steps as when plotting an ascending one, just with the difference that the trend line lies above the price action, while the cloned line is below.
Ranging channel
A ranging channel, or also known as a sideways or horizontal channel, is a trading range which has no difference in the angle between the nearest peaks and troughs. Basically the price is ranging within a horizontal support and resistance zone, as illustrated below.
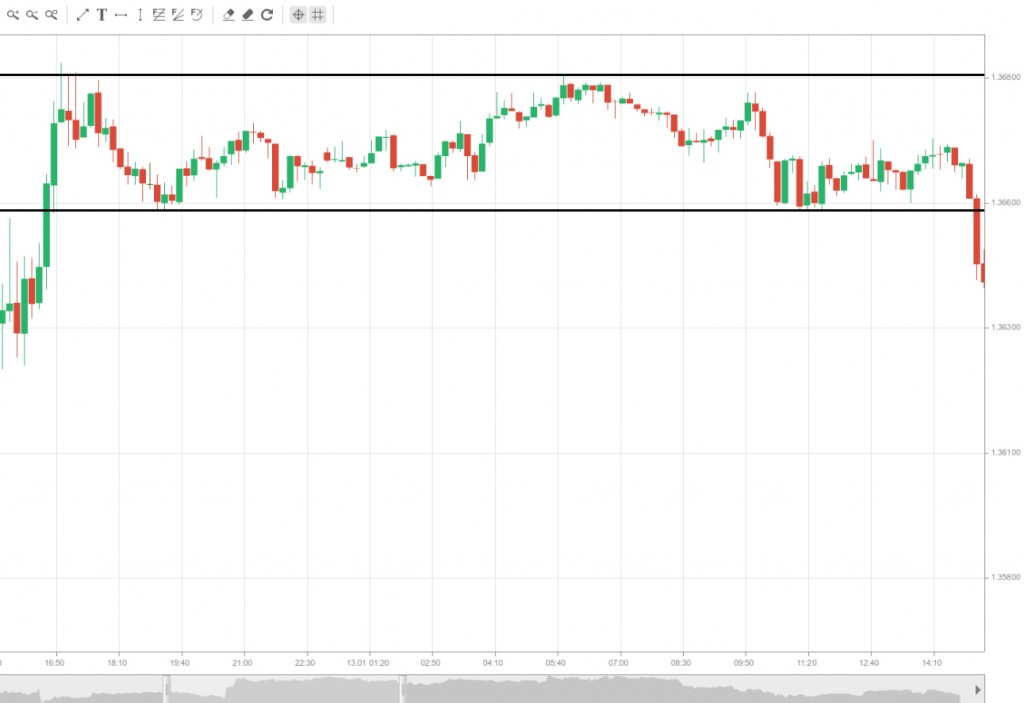
In order to draw a horizontal channel, you need to follow the same steps as with the previous two types, but here you can choose with which side to start – you can draw your trend line both below or above the price action.
How to trade channels
There are two ways in which to trade based on channel price movement. You can either trade the range, or you can trade the breakout, once it occurs.
Trading the range
Since the boundaries of any type of channel basically act as support and resistance (which we explained in the articles “Support and Resistance, Part I” and “Support and Resistance, Part II), we can use the signals generated when the price meets those levels.
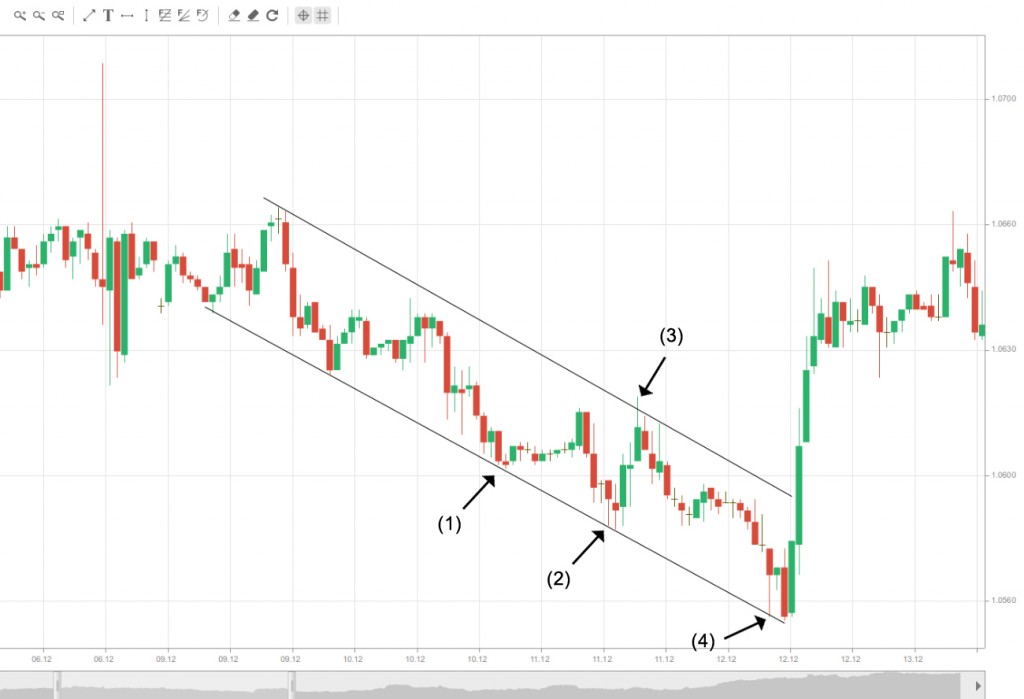
In the screenshot above you can see that (1) has generated a buy signal, and our upper boundary acts as a resistance, so this should be our profit target. At (2), we are provided with another buy signal, after which at (3) we exit our long position, thus securing profit, and we place a short order. As prices continue to decline through the channel, the market again touches the lower boundary at (4) where we exit our short position and enter a long one, guided by the generated buy-signal.
Trading the breakout
As youve already learned from the previous articles, breakouts produce very strong and broadly used trading signals, due to their high profitability. As with every other support or resistance level, prices can break through the upper or lower boundary of a channel, thus generating an entry signal.
On the example above you can see that price broke through the upper boundary, and after that continued to edge higher, thus providing a strong signal for a long entry. As weve already learned however, the possibility for a breakout to turn false always lurks around the corner, which is why it is best to wait for confirmation. It would be wise to wait for a candle to close outside the channel before placing an order, or in some cases, wait for a retest of the line.
 A potential signal for an upcoming breakout out of the channel is an acceleration, which pushes the price above the upper boundary in an ascending channel or below the lower boundary in a descending channel. Most often this is due to pure emotionalism and is thus a potential sign of a price reversal. A trader, however, especially a beginner, must never bet against the current market conditions in anticipation for a price reversal, as a wrong move could be devastating. As noted above, it would be best to wait for the breakout confirmation and then enter a position with the comfort of trading with the new trend.