Bollinger Bands
This lesson will cover the following
- What are the Bollinger Bands
- How is it calculated and visualized
- What is Bollinger Squeeze
- What value does it carry
Bollinger Bands is an oscillating indicator used to measure market volatility. They help you predict whether a price may reverse after it has become relatively high or low compared to its recent average. This could serve you as a signal to decide when to buy or sell an asset.
Bollinger Bands consist of three bands – an upper, middle and lower band – that are used to spot extreme short-term prices in a security. The upper band represents overbought territory, while the lower band can show you when a security is oversold. The center line is the prices simple moving average. Most technicians will use Bollinger Bands in conjunction with other analysis tools to get a better picture of the current state of a market or security.
Overbought, Oversold
 As stated above, Bollinger bands are comprised of three main bands or lines. The outer boundaries indicate levels where the price is considered relatively high or low compared to its recent moving average, while the central one represents the prices simple moving average. The interval between “boundaries” and the simple moving average is calculated using standard deviation implementing same data used for the middle band.
Example

On the screenshot below you can see the price touching the upper Bollinger Band.
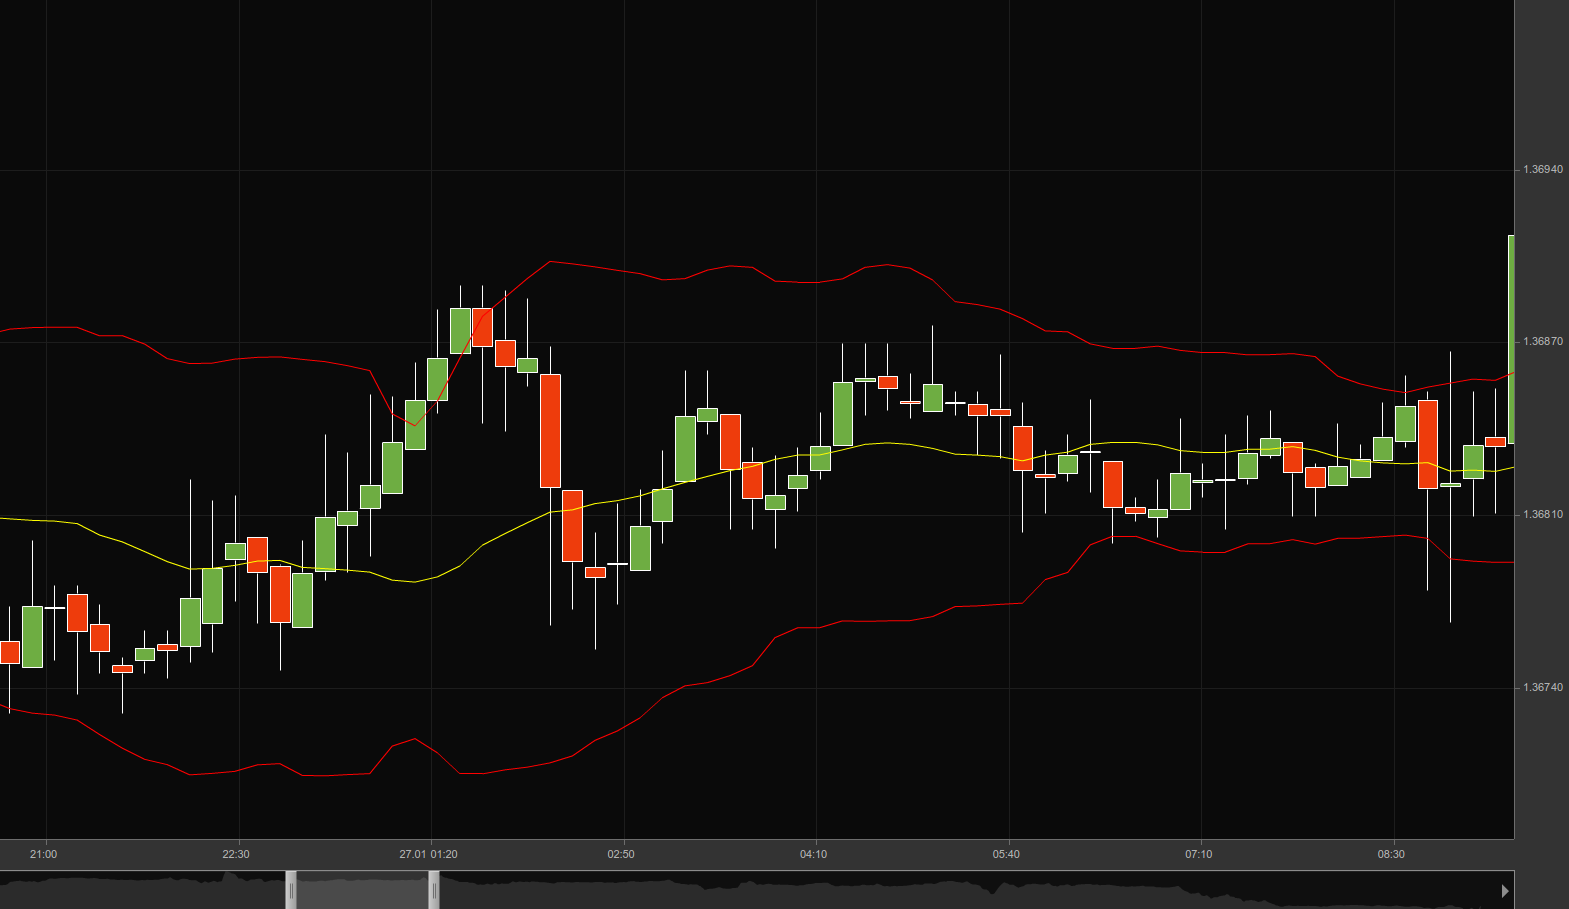
As the price reaches the upper band, the asset is considered overbought since it is trading at a relatively high price. This condition generates a bearish signal amid expectations that the price will retreat toward the moving average, therefore you should in general exit all long positions and go short. The following screenshot illustrates the opposite situation.
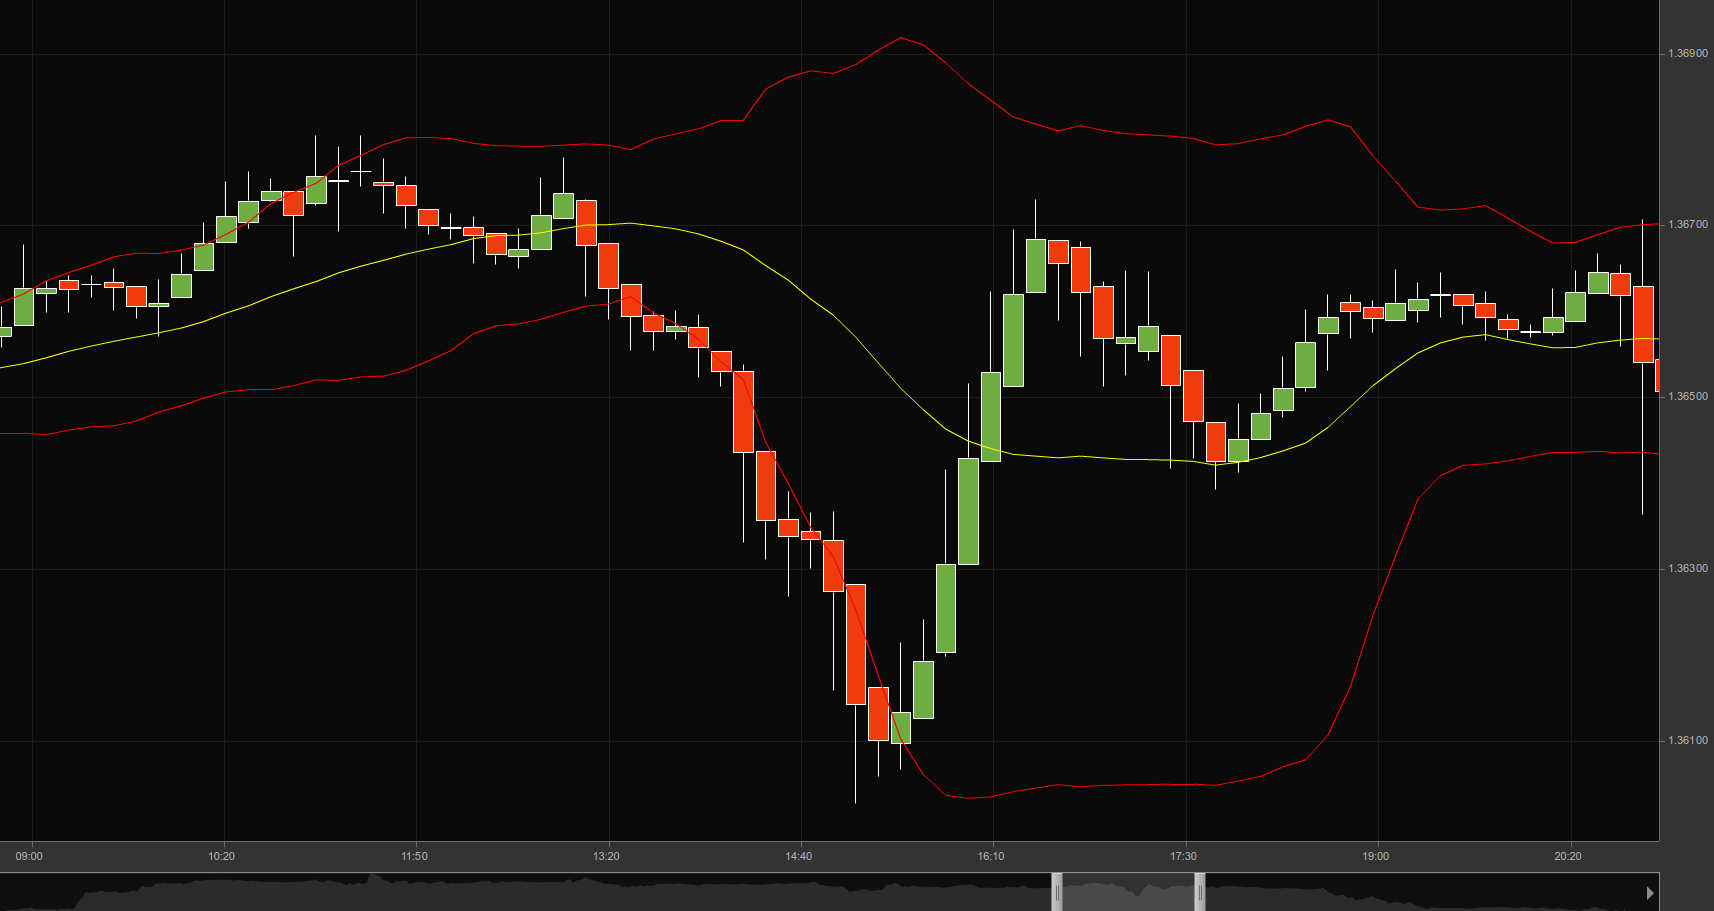
Conversely, when the price approaches the lower band, the asset is considered oversold since it is trading at a relatively low price compared to its recent average. This logically is deemed a bullish signal because the price will likely rebound and retrace back to the moving average. The most logical action here is to close your short positions and place long orders.
However, as a trader you should be cautious when taking positions based only on overbought and oversold signals. Just because the price has reached the upper or lower band doesnt ensure a reversal. A further confirmation will be required by using patterns or another indicator to point out that the price is reversing before you place an order.
Bollinger Squeeze
 This situations name pretty much speaks for itself. When the bands narrow the distance between each other, it usually means that a breakout is about to occur. If the candles start to break out above the top band, then the price movement will likely continue to edge higher. Conversely, if the candles break out below the lower band, then the price is generally expected to continue moving down.
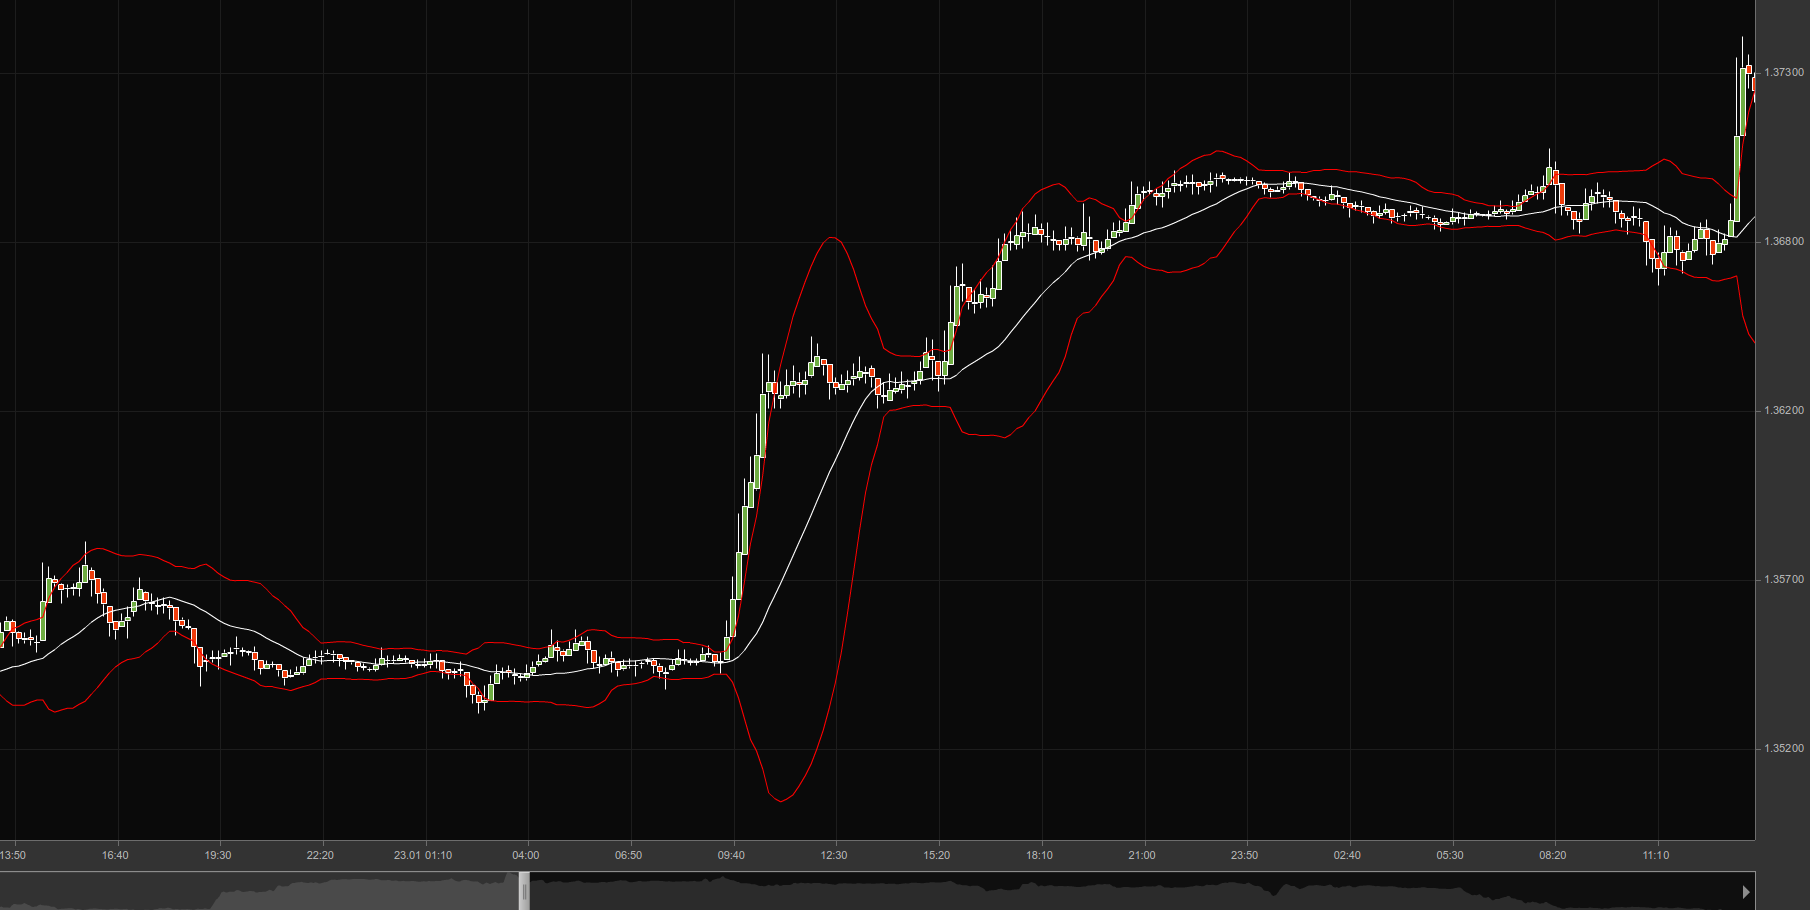
On the picture below you can easily see the squeeze of the bands and the followed breakout.
 This setup allows you to catch a move as early as possible, but it doesnt occur every day. However, on small time frames such as 10 or 15 minutes you can probably see a Bollinger Squeeze several times per week.
Changing the settings
 As with many other indicators, Bollinger Bands settings can also be fine-tuned so that each trader can adjust the indicator to best suit his unique trading system.
Using a smaller number of periods for the middle band makes it more reactive and results in a choppier upper and lower bands. The price breaks the bands more often, giving more trading opportunities. However, it also generates more false trading signals.
Setting a higher number of periods will make it less reactive and result in a smoother line. The price breaks the upper and lower bands less often, giving fewer, but more reliable signals.
The Middle Band
 The middle band is usually set as a 20-period simple moving average as default in many charting applications. Every trading instrument is different and some will respect the 20 period SMA, while some will not. In some cases you will need to modify the simple moving average to a trackback period that the instrument respects. This is curve-fitting but we want to put the odds in our favor.
Value
 Where Bollinger Bands derive their value from is their tendency to contract and expand. Market trends usually form from periods of low volatility, plotted on the chart as sideways movement, which allows us to relatively accurately spot when a trend is about to emanate. During range-bound market movement, the Bollinger Bands will squeeze in because each periods closing price is close to the average.
You can often observe that the market is waiting for the release of key economic indicators or central bank announcements before trending in any direction. Prices can begin moving into a sustained trend upon the release of the economic figures.
The opposite of the Bollinger Squeeze, which we mentioned happens during range-bound trade, is the tendency for Bollinger Bands to expand during a trend. Actually, in the beginning of a new trend, the two Bollinger Bands will move in the opposite direction, thus confirming the formation of a trend. However, as the price continues to trend, any decrease in momentum will cause the boundary heading away from the trend to turn around toward the trend. This proves to be the first clue for deceleration in momentum, suggesting you should scale out of the trade or close all of your positions.
The next indication for the trend coming to an end is when both Bollinger Bands begin to contract, alerting you that the market is entering a range, an advisable exit point from the entire trade.
A challenge you will encounter when using Bollinger Bands is that you must wait for the period to close (the candlestick/bar to be completely plotted) before you can estimate the final value of the Bollinger Band. This means that Bollinger Bands value fluctuates with the live bar.